The new 2018 Global Digital suite of reports from We Are Social and Hootsuite reveals that there are now more than 4 billion people around the world using the internet.
Well over half of the world’s population is now online, with the latest data showing that nearly a quarter of a billion new users came online for the first time in 2017. Africa has seen the fastest growth rates, with the number of internet users across the continent increasing by more than 20 percent year-on-year.
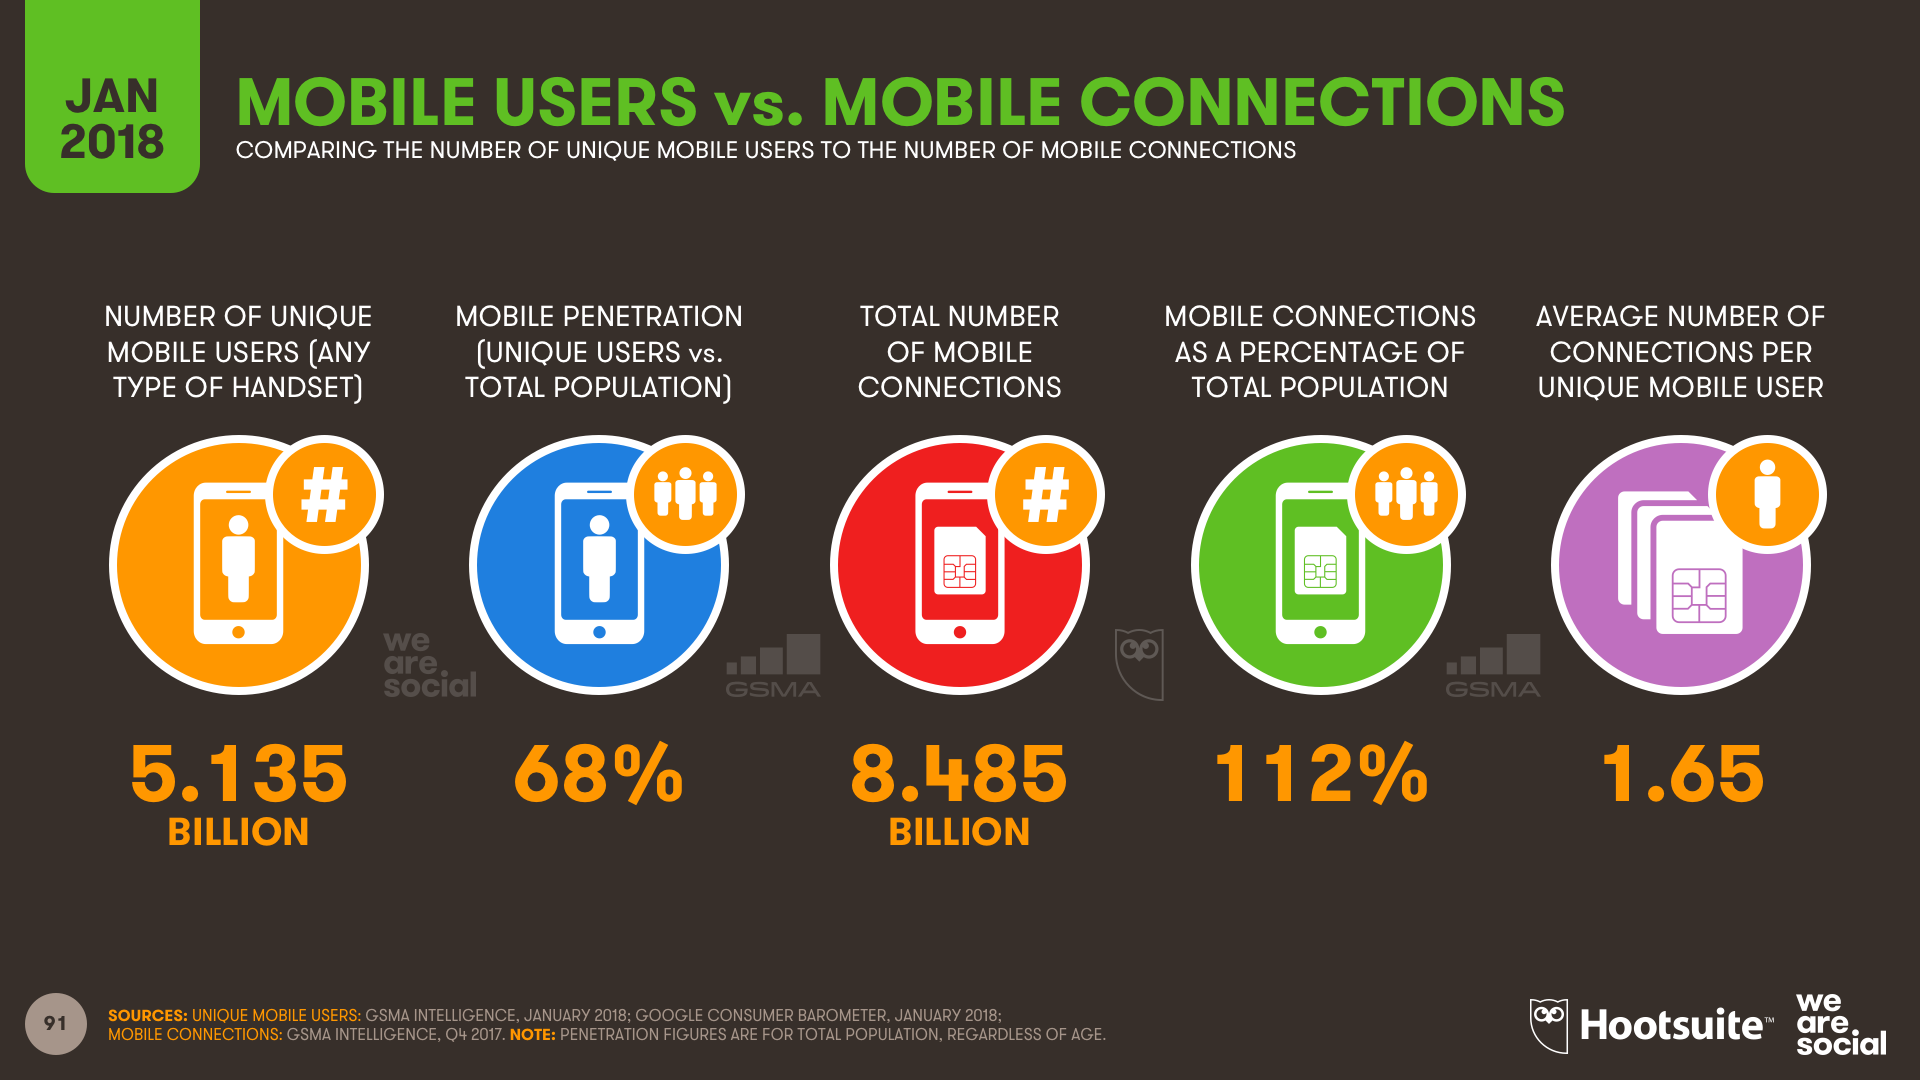
Much of this year’s growth in internet users has been driven by more affordable smartphones and mobile data plans. More than 200 million people got their first mobile device in 2017, and two-thirds of the world’s 7.6 billion inhabitants now have a mobile phone.
More than half of the handsets in use today are ‘smart’ devices too, so it’s increasingly easy for people to enjoy a rich, ‘connected’ experience wherever they are.
Social media use continues to grow rapidly too, and the number of people using the top platform in each country has increased by almost 1 million new users every day during the past 12 months. More than 3 billion people around the world now use social media each month, with 9 in 10 of those users accessing their chosen platforms via mobile devices.
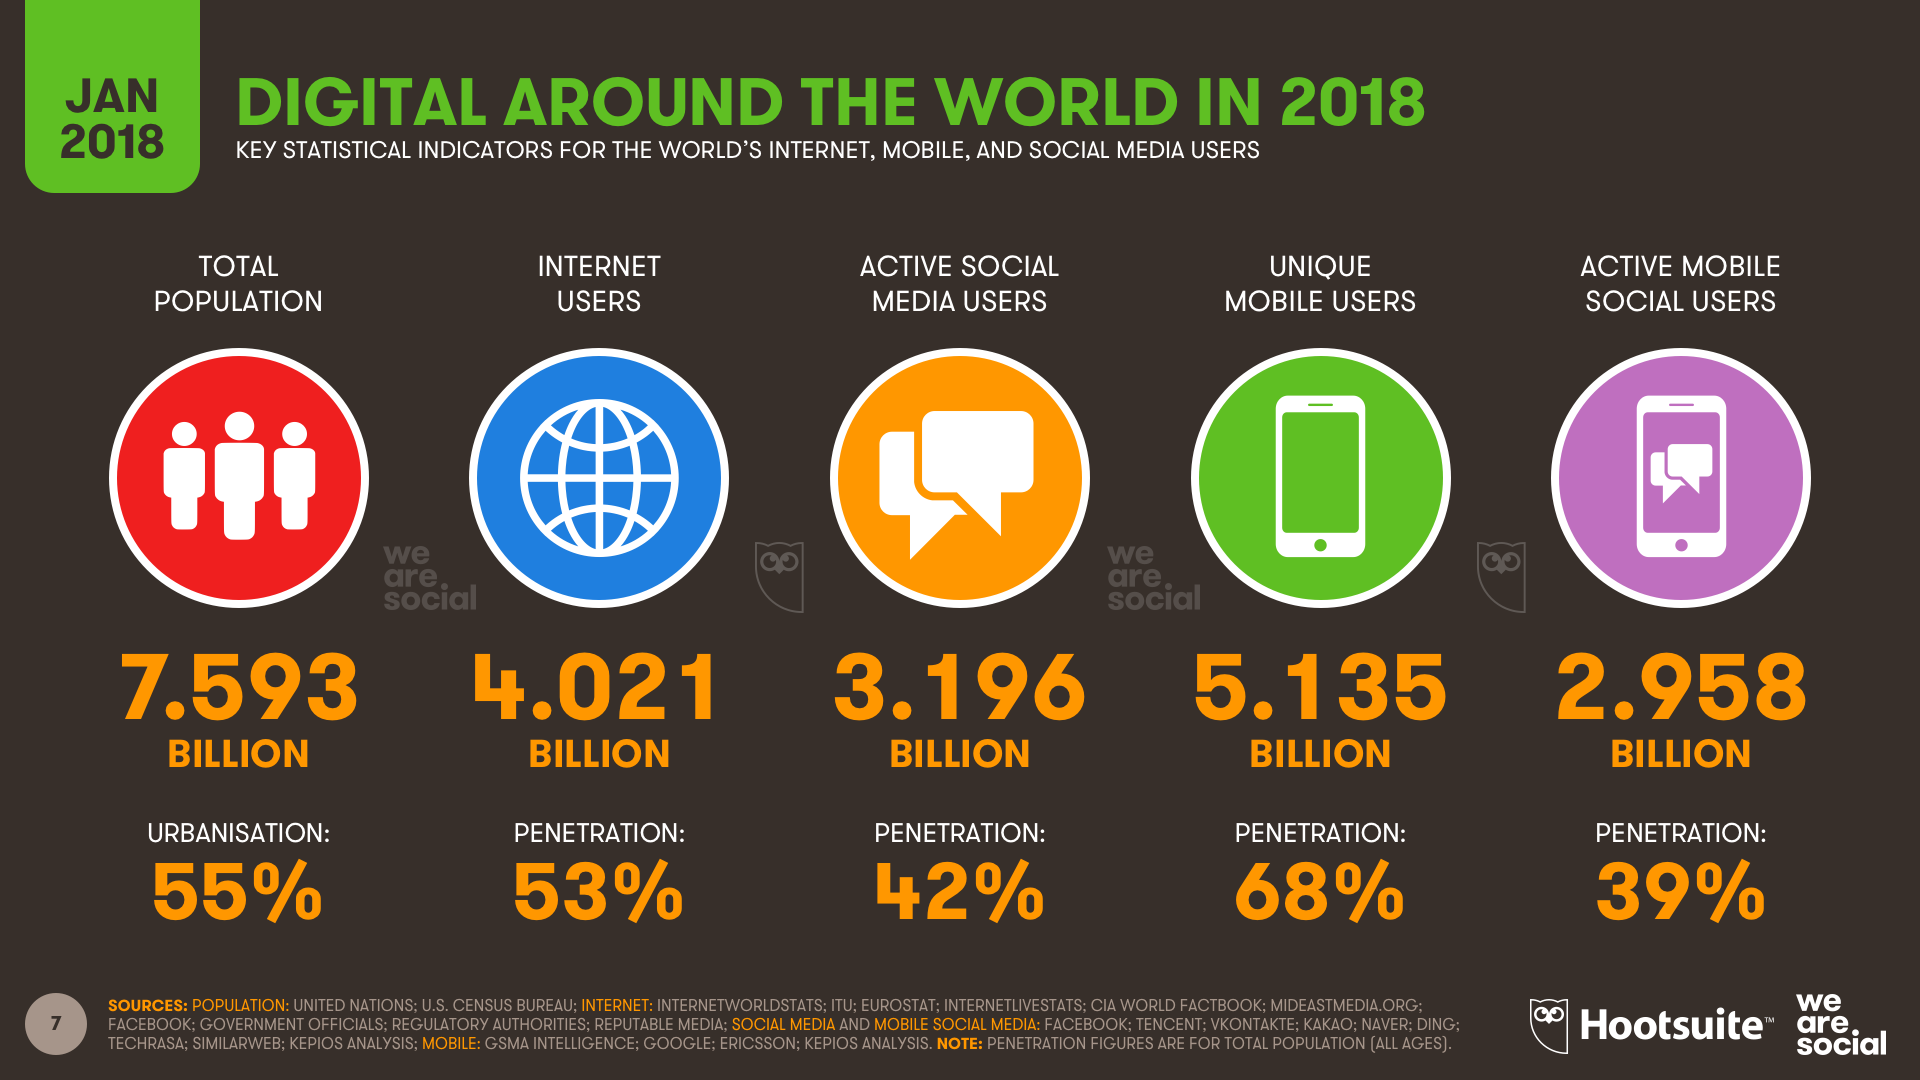
You’ll find the key insights from this year’s reports in my detailed analysis below, but here are the essential headlines for digital in 2018:
- The number of internet users in 2018 is 4.021 billion, up 7 percent year-on-year
- The number of social media users in 2018 is 3.196 billion, up 13 percent year-on-year
- The number of mobile phone users in 2018 is 5.135 billion, up 4 percent year-on-year
Just before we dig into those essential findings, I’d like to say a very big thank you to the data partners making this year’s reports possible:
- GlobalWebIndex
- GSMA Intelligence
- Statista
- Locowise
- SimilarWeb
So, what does all of their valuable data tell us?
1. A billion years
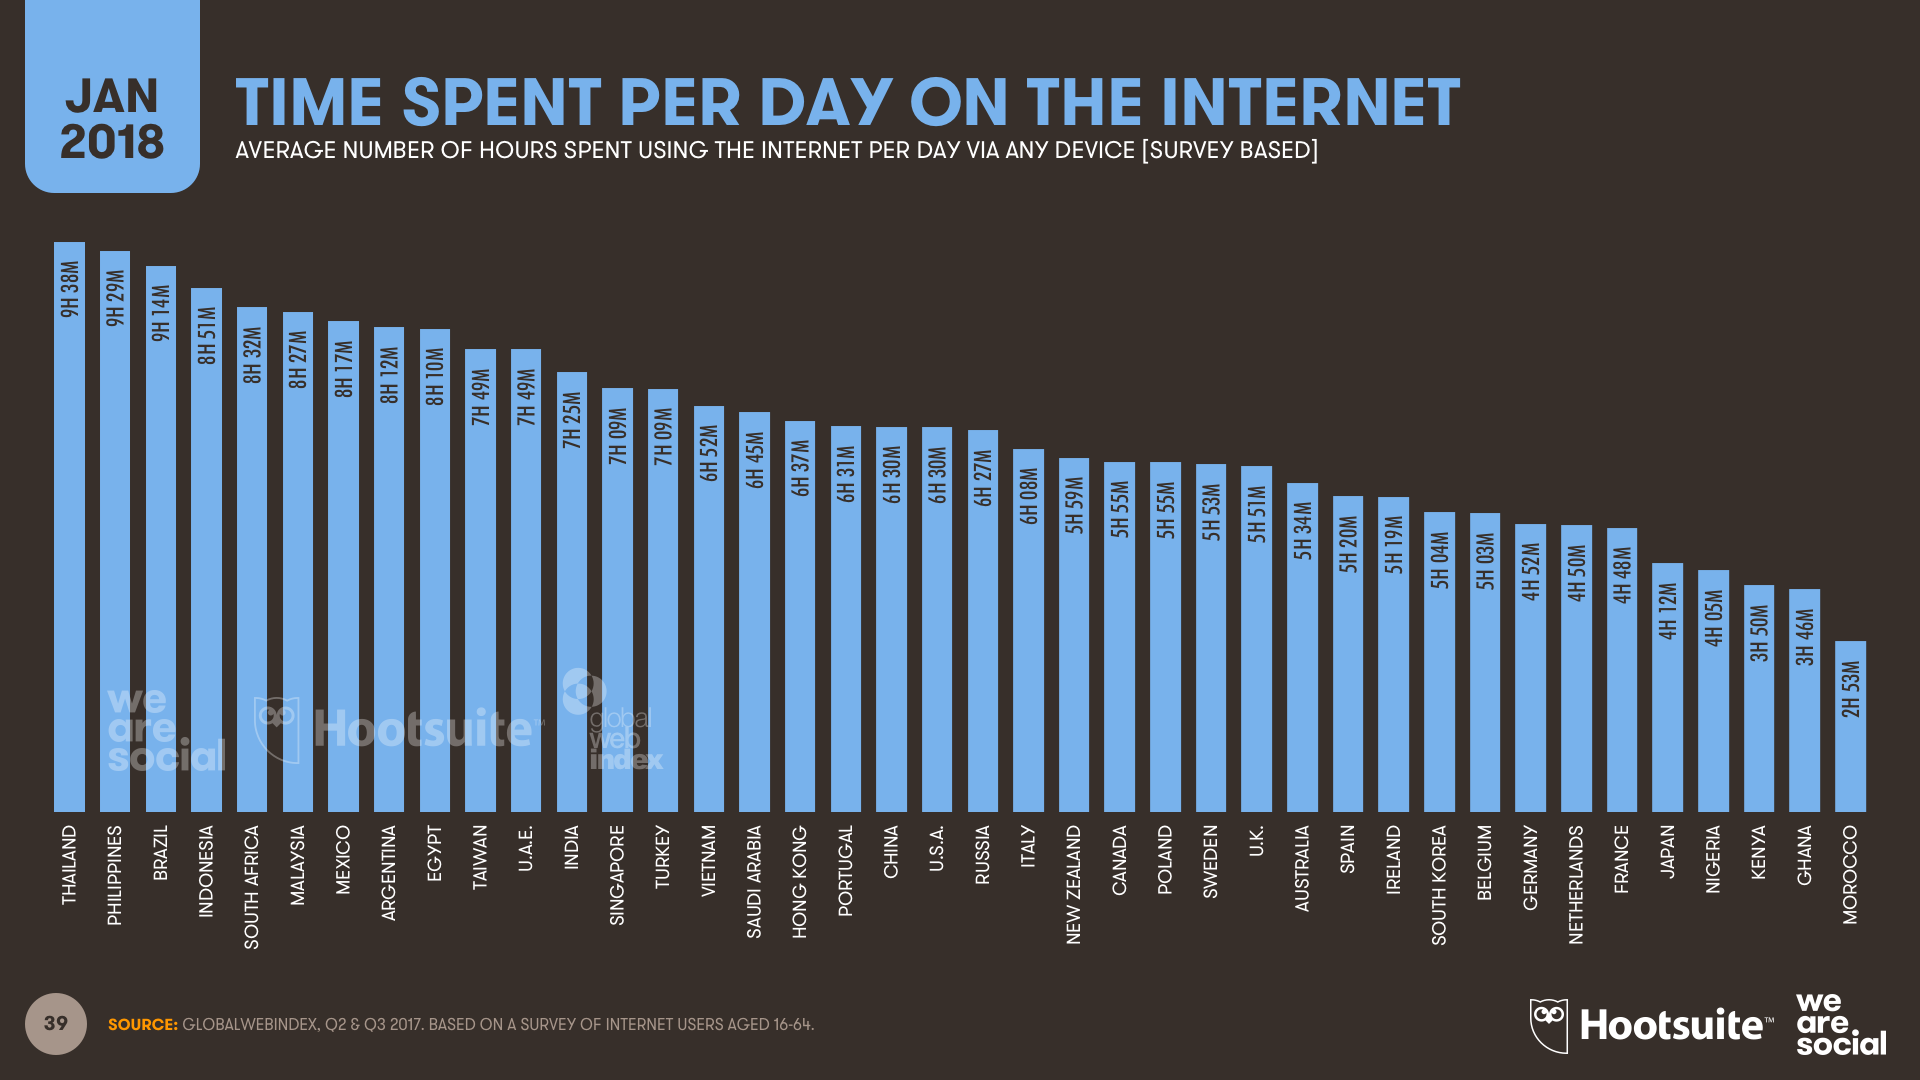
It’s not just the number of people using the internet that has increased this year; the amount of time that people spend on the internet has also gone up over the past 12 months.
The latest data from GlobalWebIndex shows that the average internet user now spends around 6 hours each day using internet-powered devices and services – that’s roughly one-third of their waking lives.
If we add this together for all 4 billion of the world’s internet users, we’ll spend a staggering 1 billion years online in 2018.
2. Distributing the future
As I noted in last year’s analysis report, internet access isn’t evenly distributed around the world.
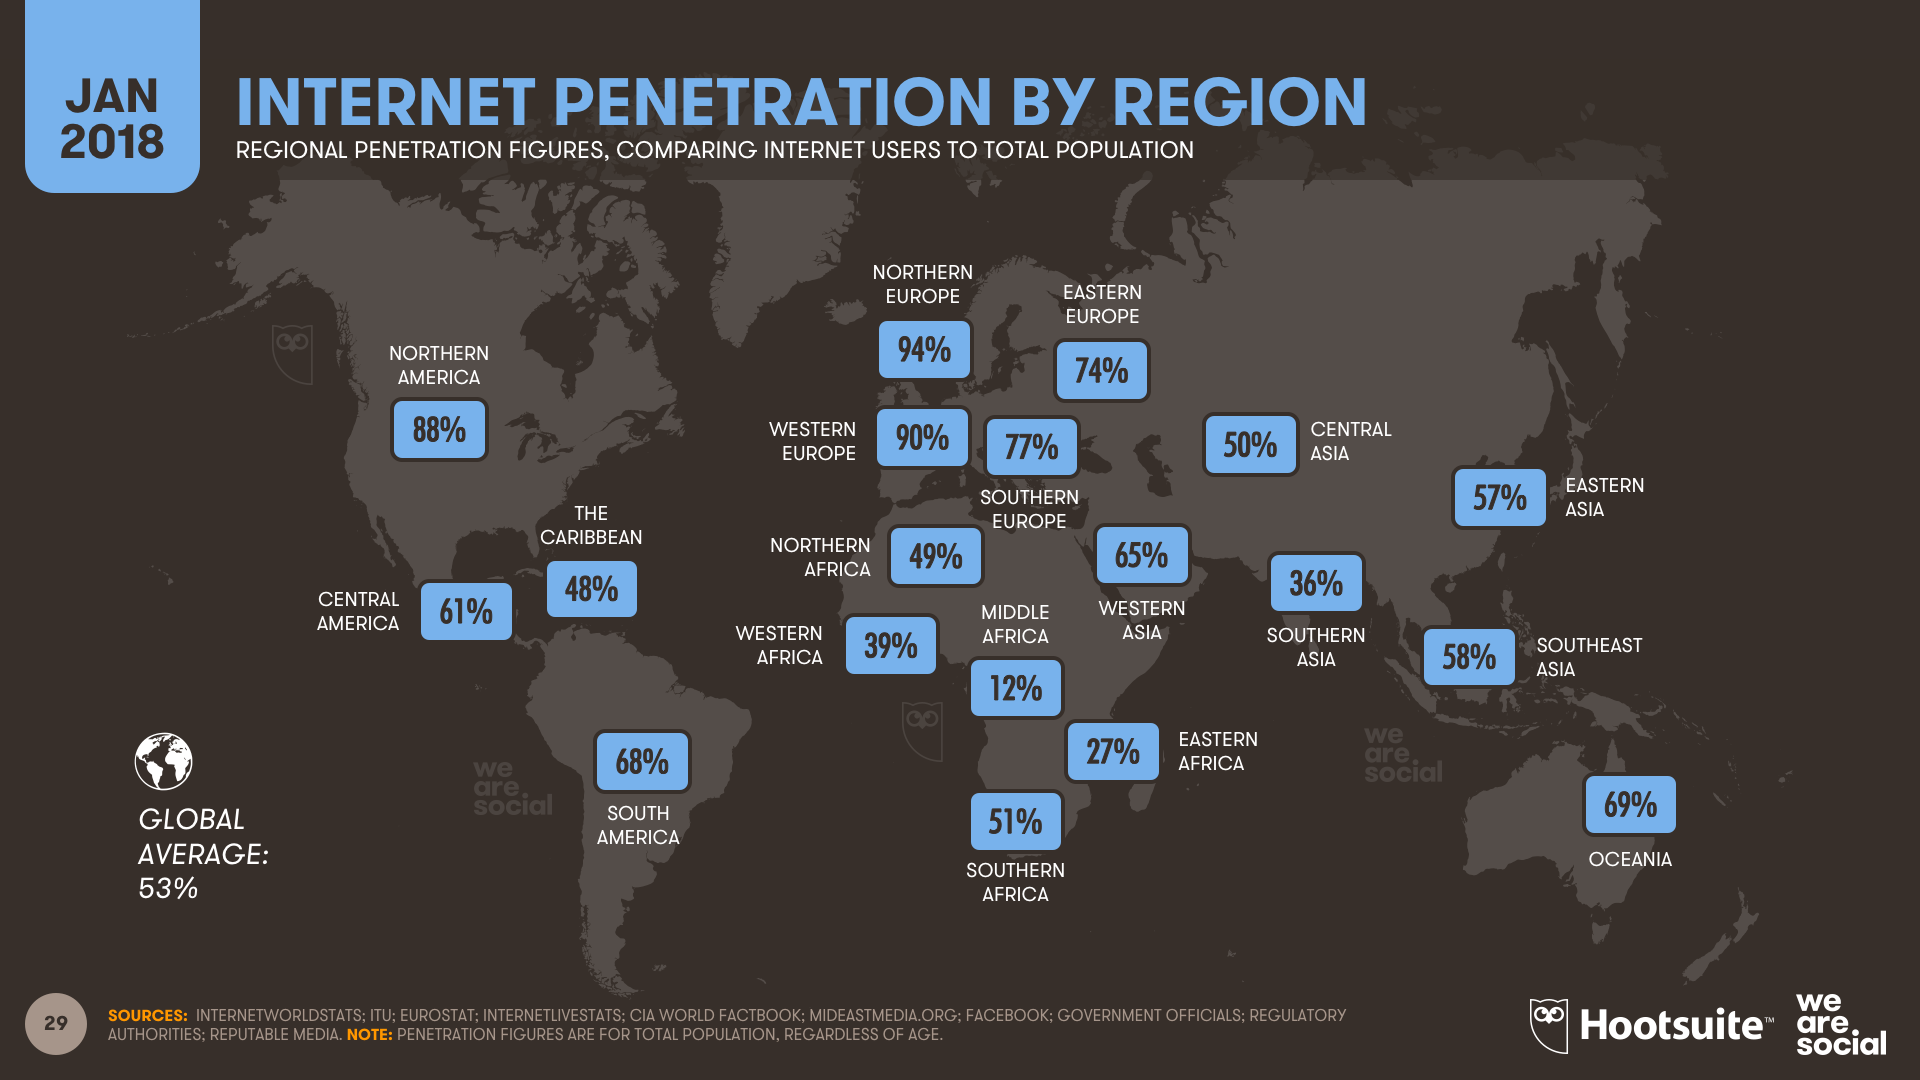
That’s still true in 2018, but things are starting to change.
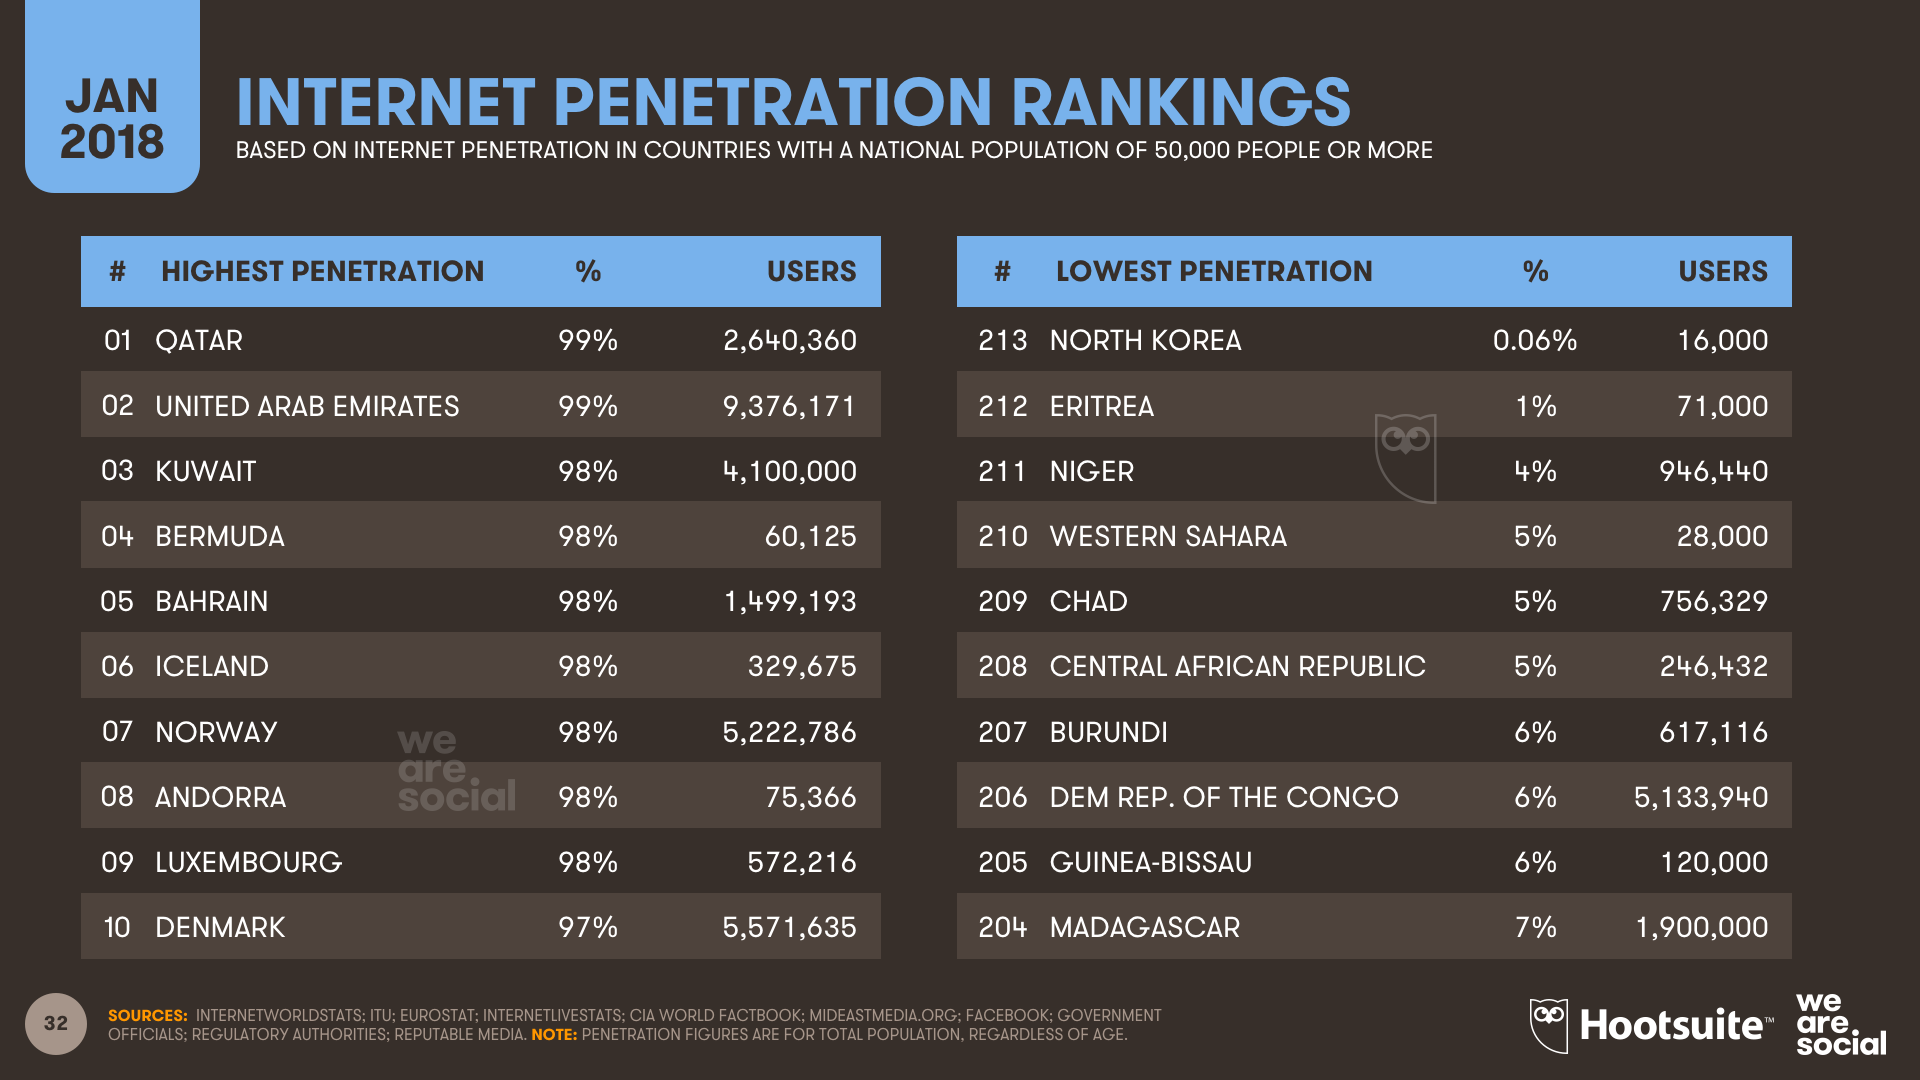
Internet penetration rates may still be low across much of Central Africa and Southern Asia, but these regions are also seeing the fastest growth in internet adoption.
Users in Africa are up by more than 20 percent year-on-year, with the reported number of internet users in Mali increasing by almost 6 times since January 2017. The number of internet users in Benin, Sierra Leone, Niger, and Mozambique has more than doubled over the past year too.
This isn’t just a story about ‘the next billion’, though.
Accelerating access in developing economies will impact the internet experience for users everywhere, as companies like Google, Facebook, Alibaba, and Tencent strive to deliver scalable global products that address the needs and contexts of these new users.
These changes will have a profound influence on the future of the internet, so we’ll explore this topic in more detail in a separate blog post over the next few days.
3. Connections to go
More than two-thirds of the world’s population now has a mobile, with most people now using a smartphone.
The number of unique mobile users around the world is up by more than 4 percent year-on-year, although penetration rates remain below 50 percent across much of Central Africa.
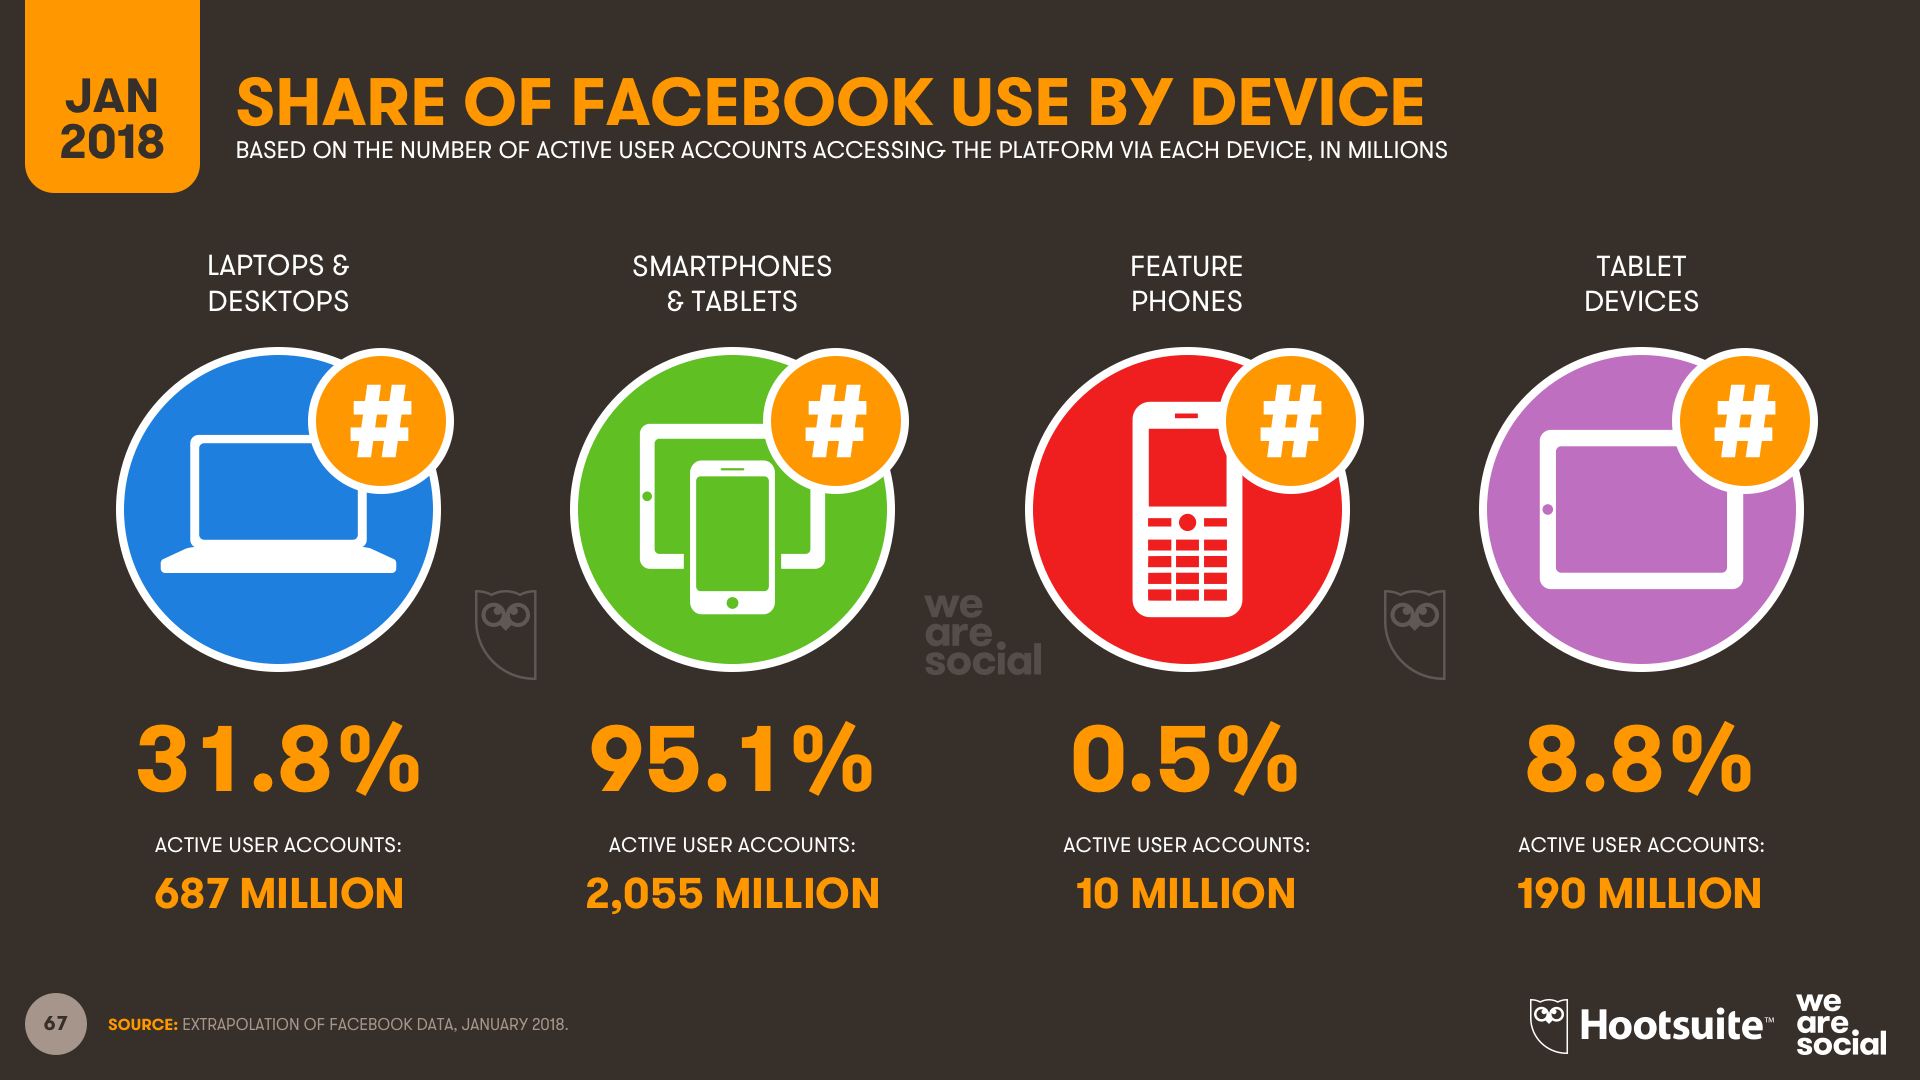
Smartphones are the world’s preferred choice for going online too, accounting for a greater share of web traffic than all other devices combined.

What’s more, this data is just for web use. The latest data from App Annie shows that people now spend 7 times longer using mobile apps compared to mobile web browsers, so mobile’s ‘share of internet’ is likely even higher than the figures above suggest.
The latest data from Facebook reinforces this finding, with just 5 percent of the platform’s global user base not accessing the platform via a mobile device.
4. Eleven new users a second
Almost 1 million people started using social media for the first time every day over the past year – that’s equivalent to more than 11 new users every second.
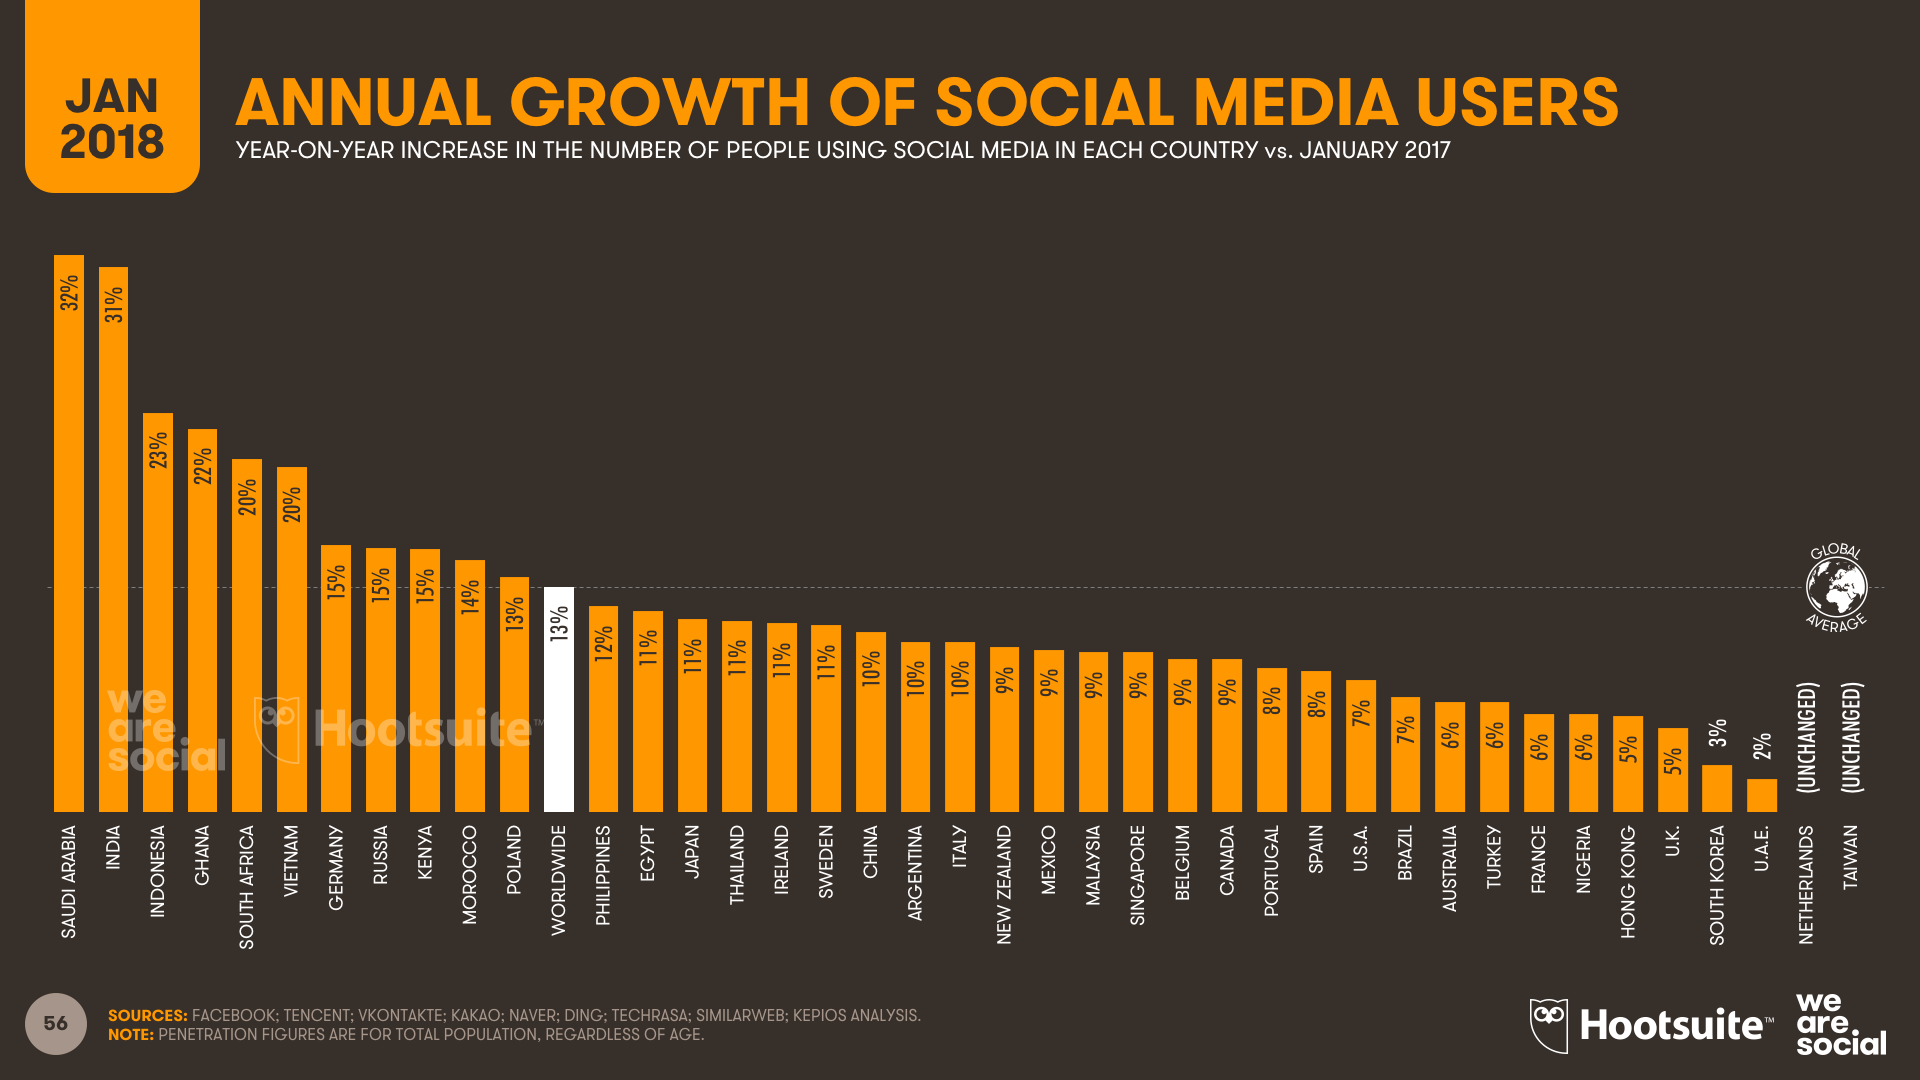
The global number of people using social media has grown by 13 percent in the past 12 months, with Central and Southern Asia recording the fastest gains (up 90 percent and 33 percent respectively).
Saudi Arabia has posted the fastest individual country growth rate across our 40 focus economies at 32 percent, but India is only just behind, with 31 percent annual growth in social media users.
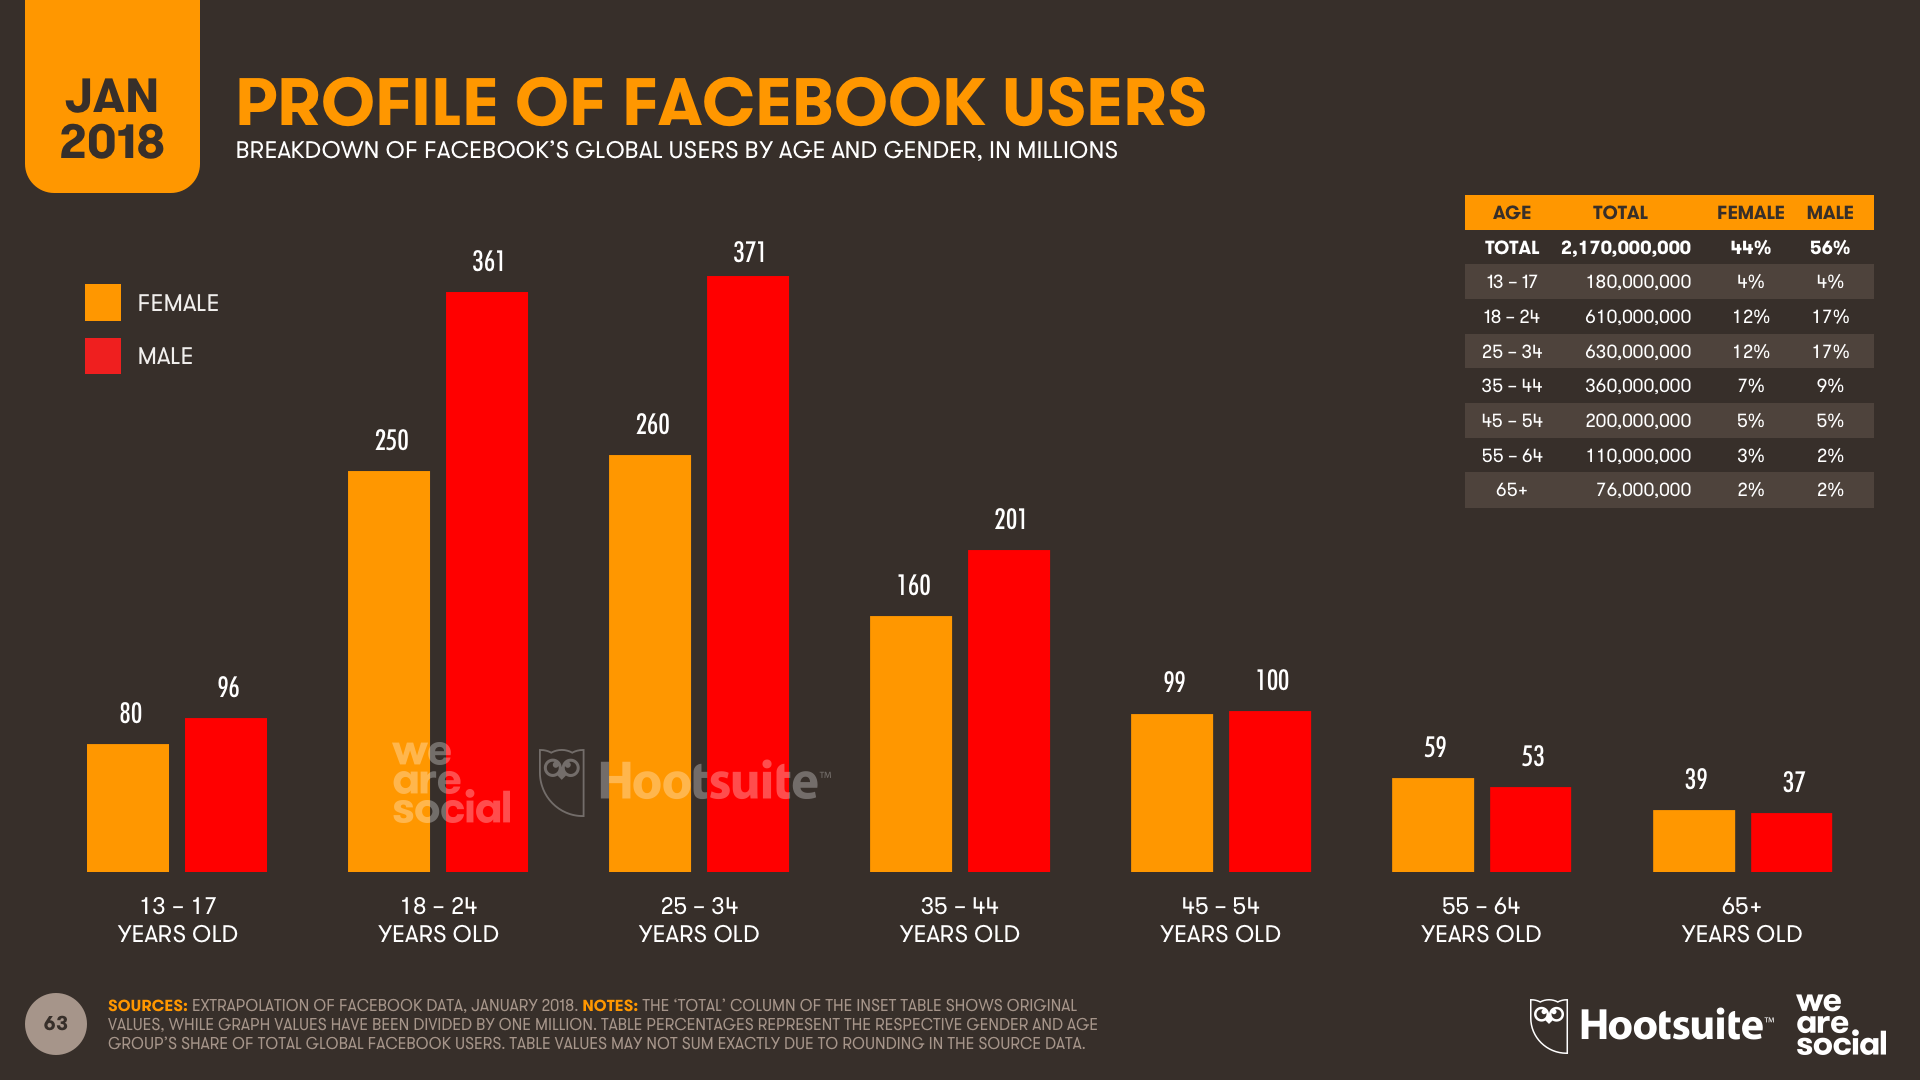
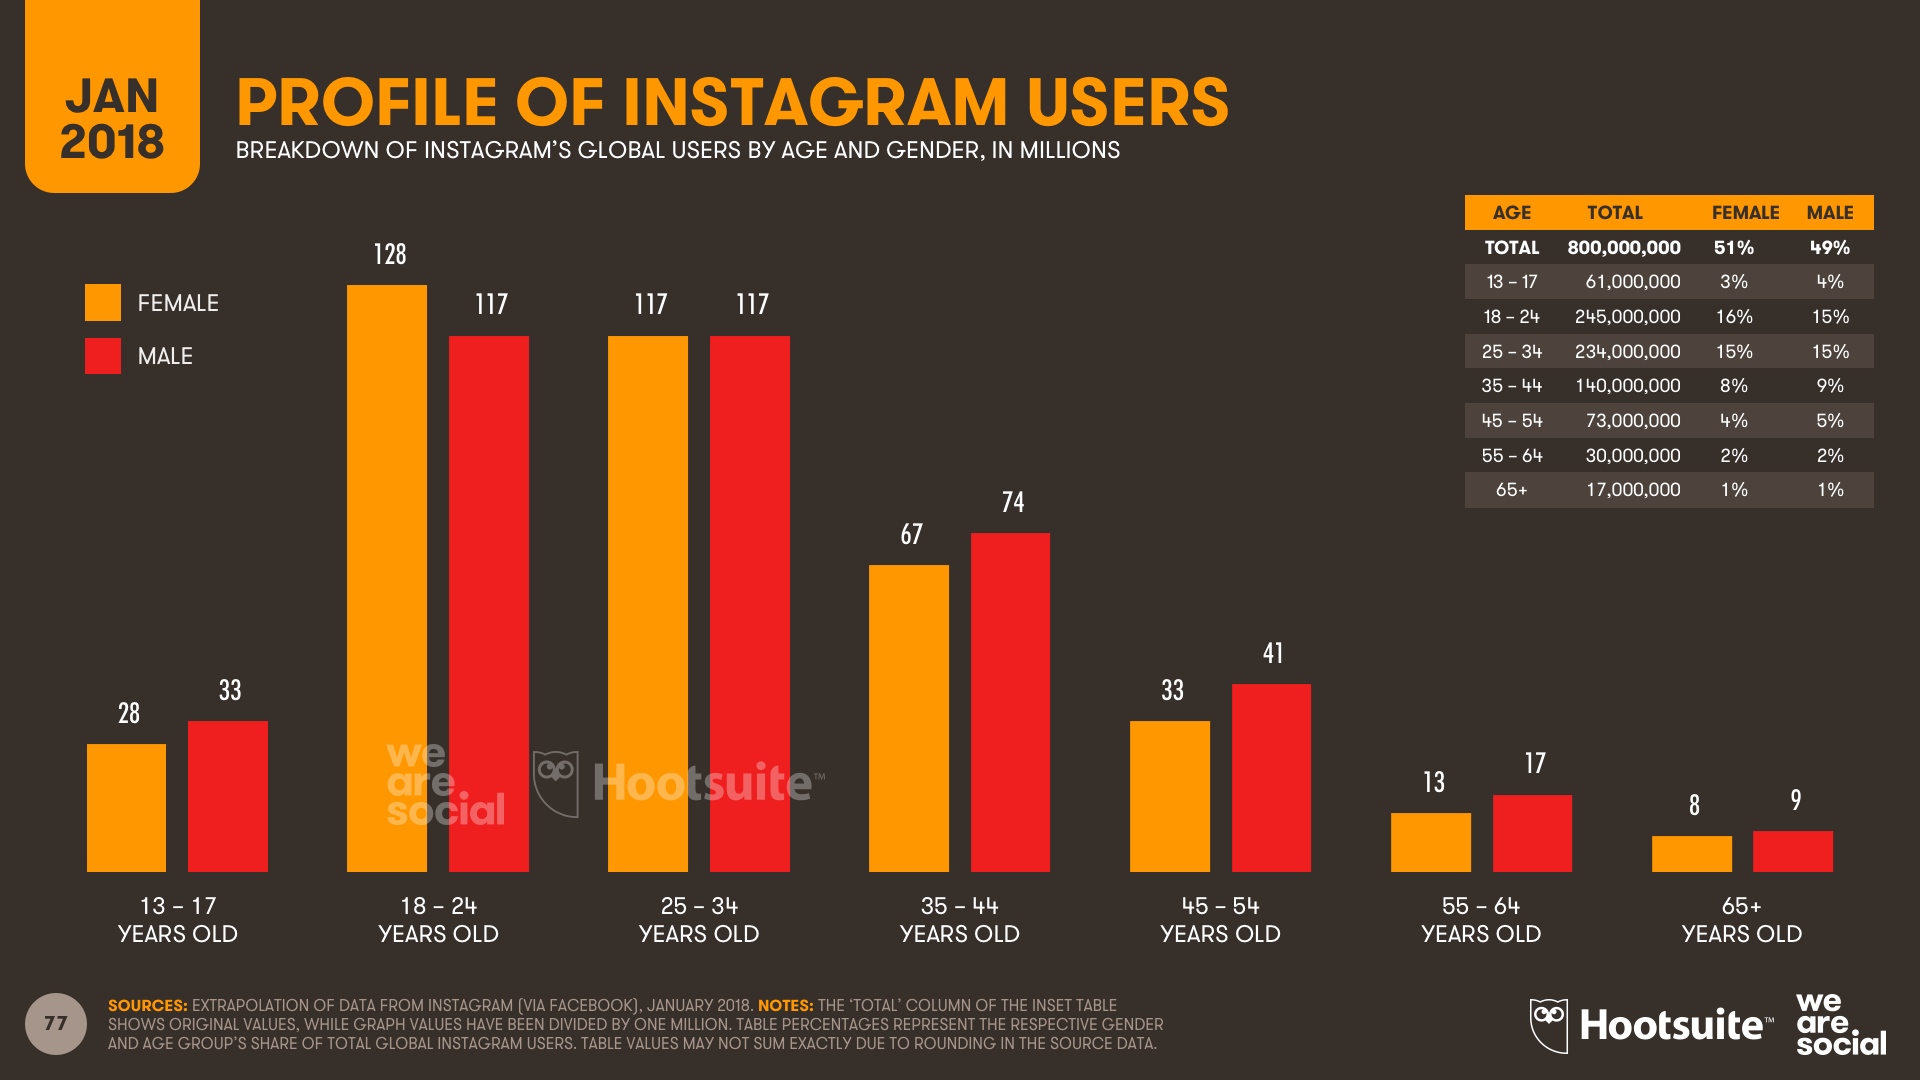
As part of this growth, we’re seeing larger numbers of older users joining social media too. On Facebook alone, the number of users aged 65 and above has increased by almost 20 percent in the past 12 months.
The number of teenagers using Facebook has also increased, but the number of users aged 13 to 17 has only grown by 5 percent since January 2017.
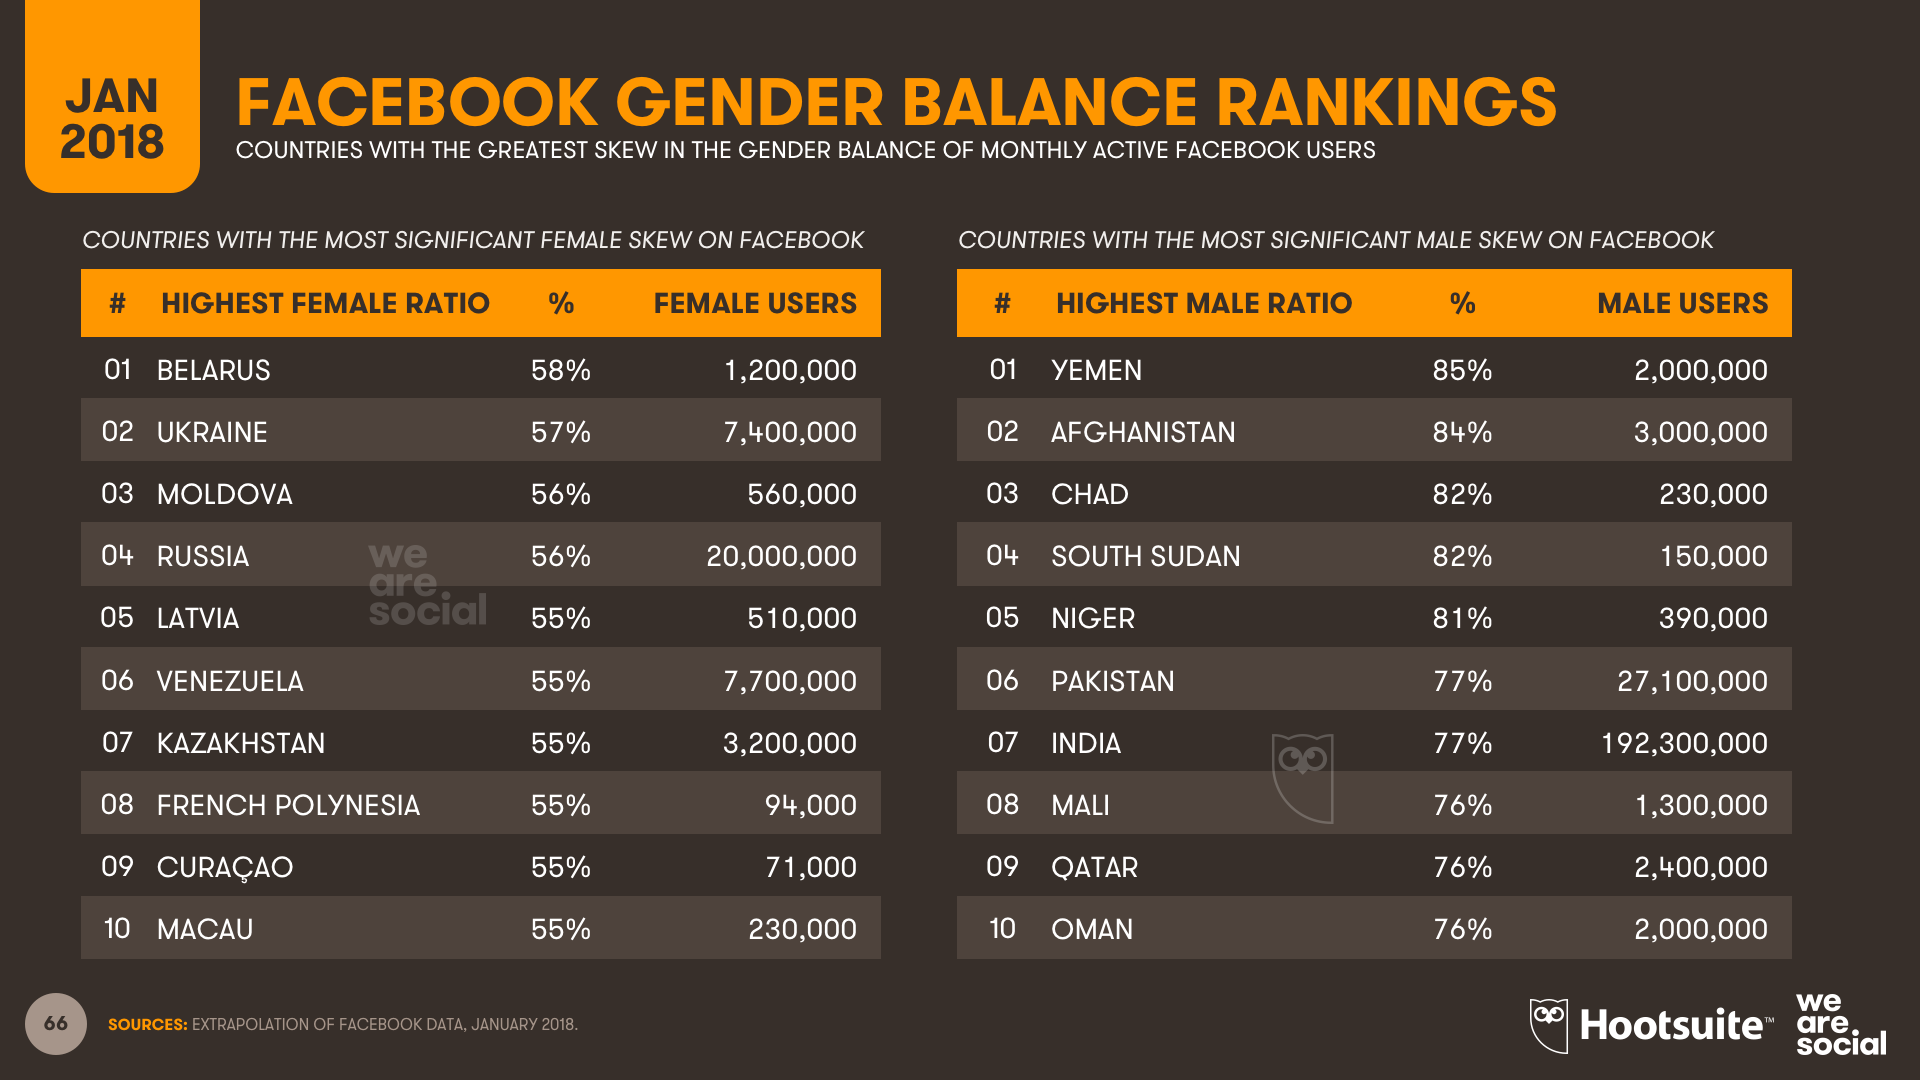
Gender ratios remain a concern across the internet though, with the latest data from Facebook suggesting that women are still significantly underrepresented across much of Central Africa, the Middle East, and Southern Asia.
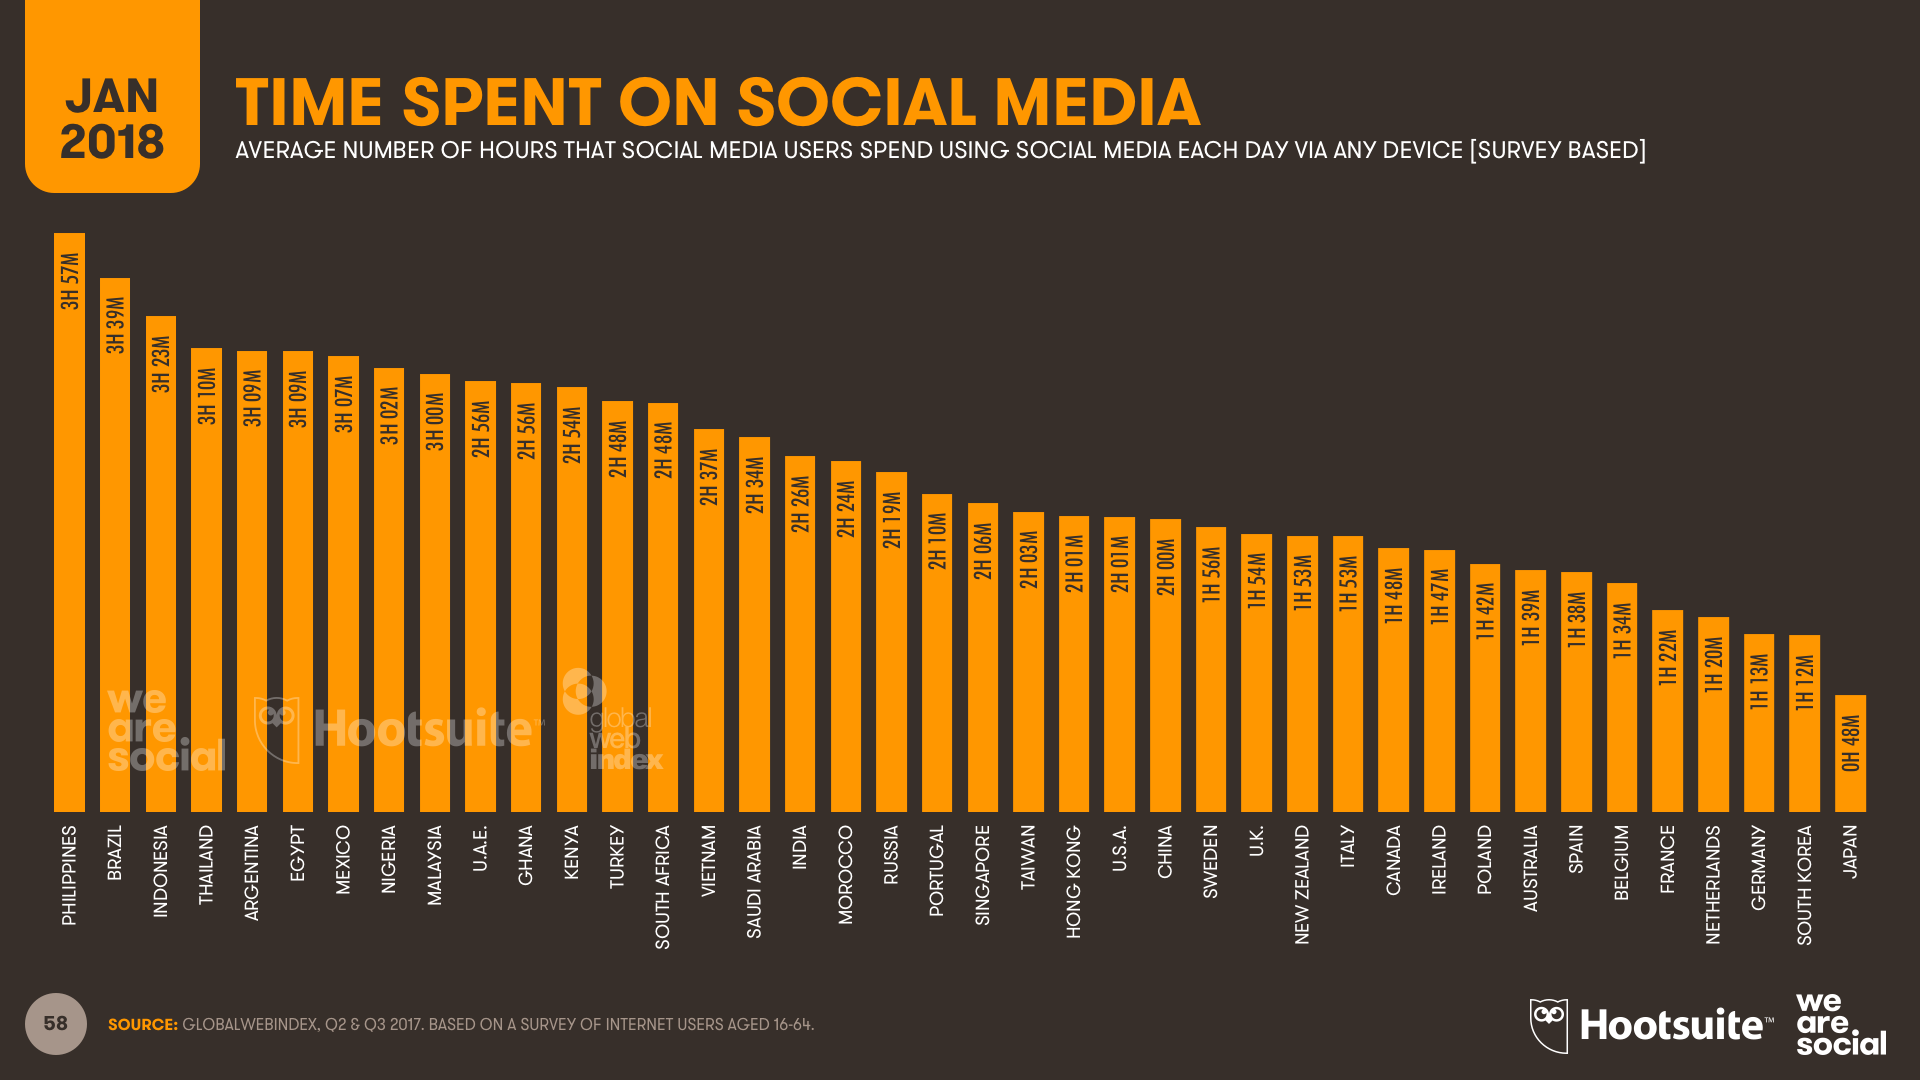
5. The Philippines keeps its crown
For the third year in a row, Filipinos spend the greatest amount of time on social media, with the average user in the country spending almost 4 hours on social every day.
The Brazilians are catching up though, and the Indonesians and the Thais have overtaken the Argentinians to take the third and fourth spots in this year’s rankings.
6. Facebook still dominates
It’s been another good year for Mark Zuckerberg and team, with all of Facebook Inc.’s platforms posting impressive growth during 2017.
Facebook’s core platform still dominates the global social landscape, with total users up 15 percent year-on-year to reach almost 2.17 billion at the start of 2018.
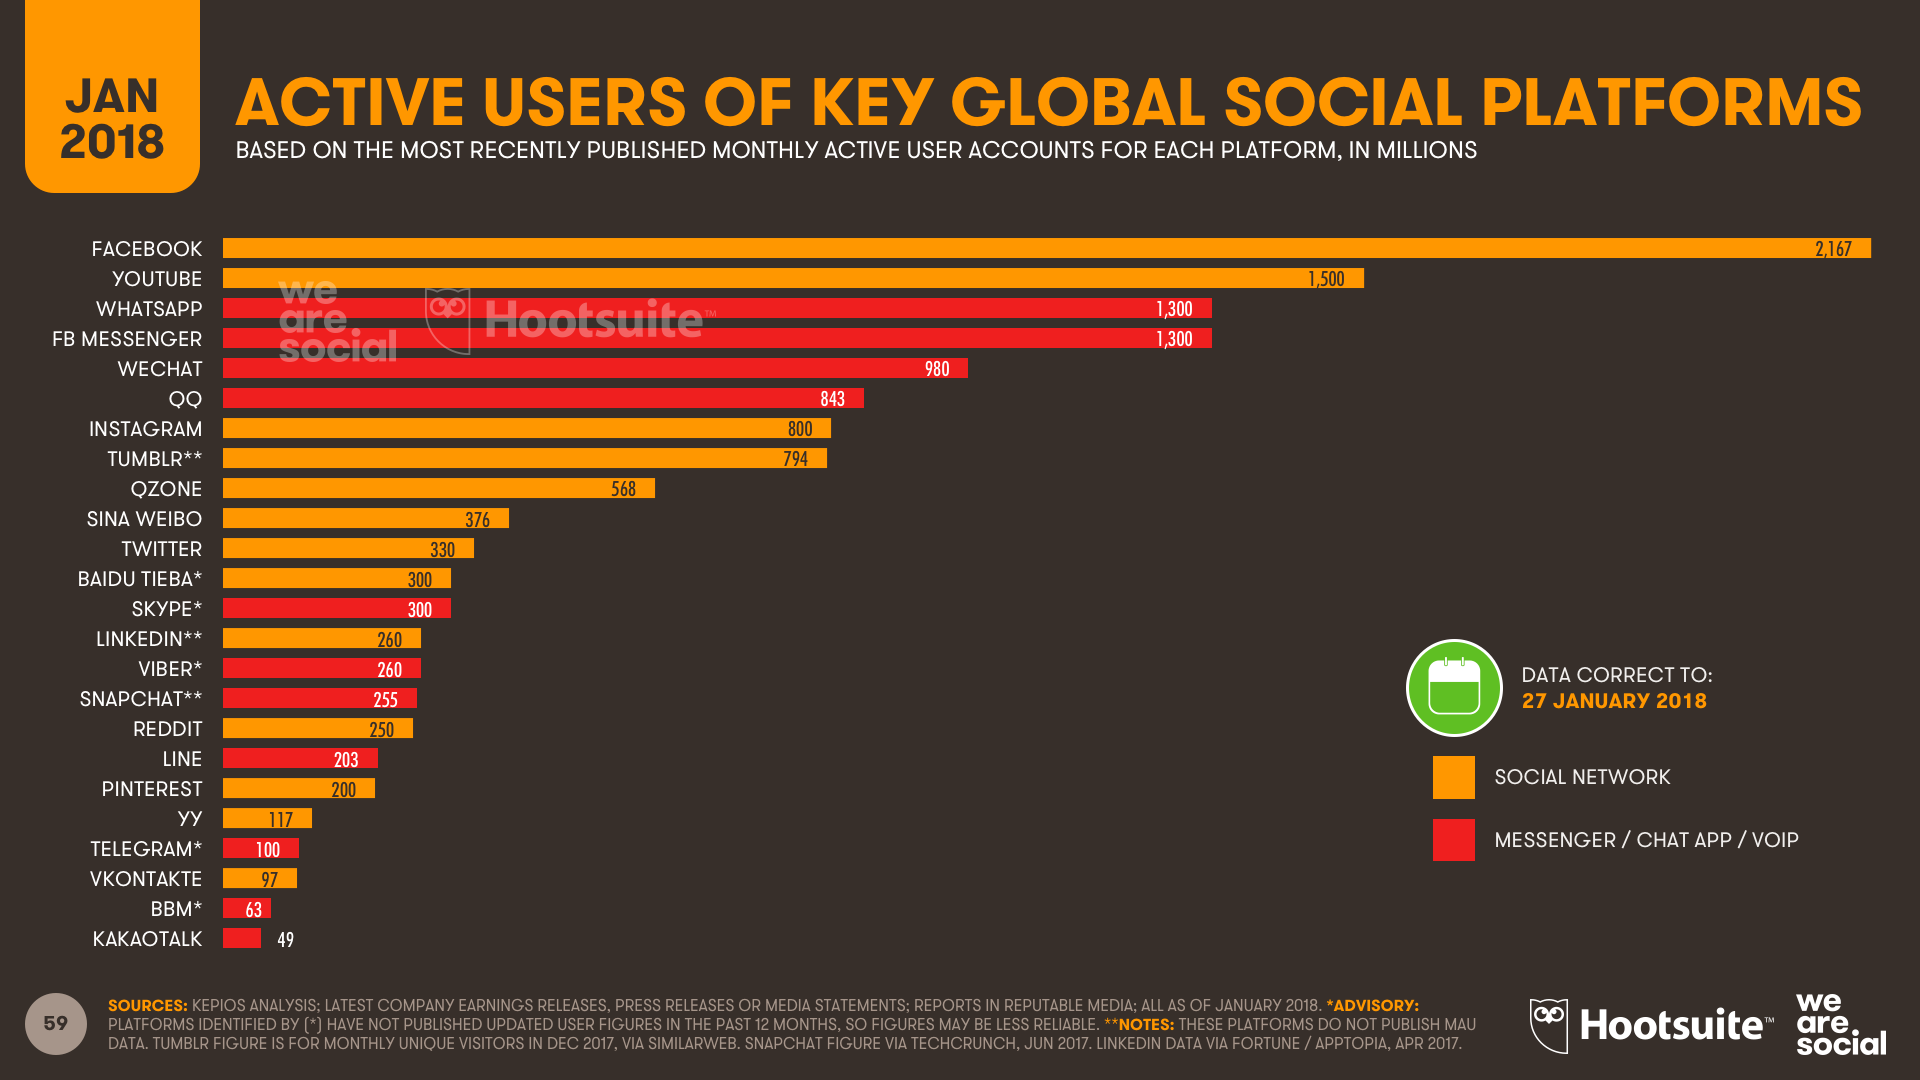
WhatsApp and Facebook Messenger both grew twice as fast as the core Facebook platform though, with the number of people using each messenger app up by 30 percent year on year.
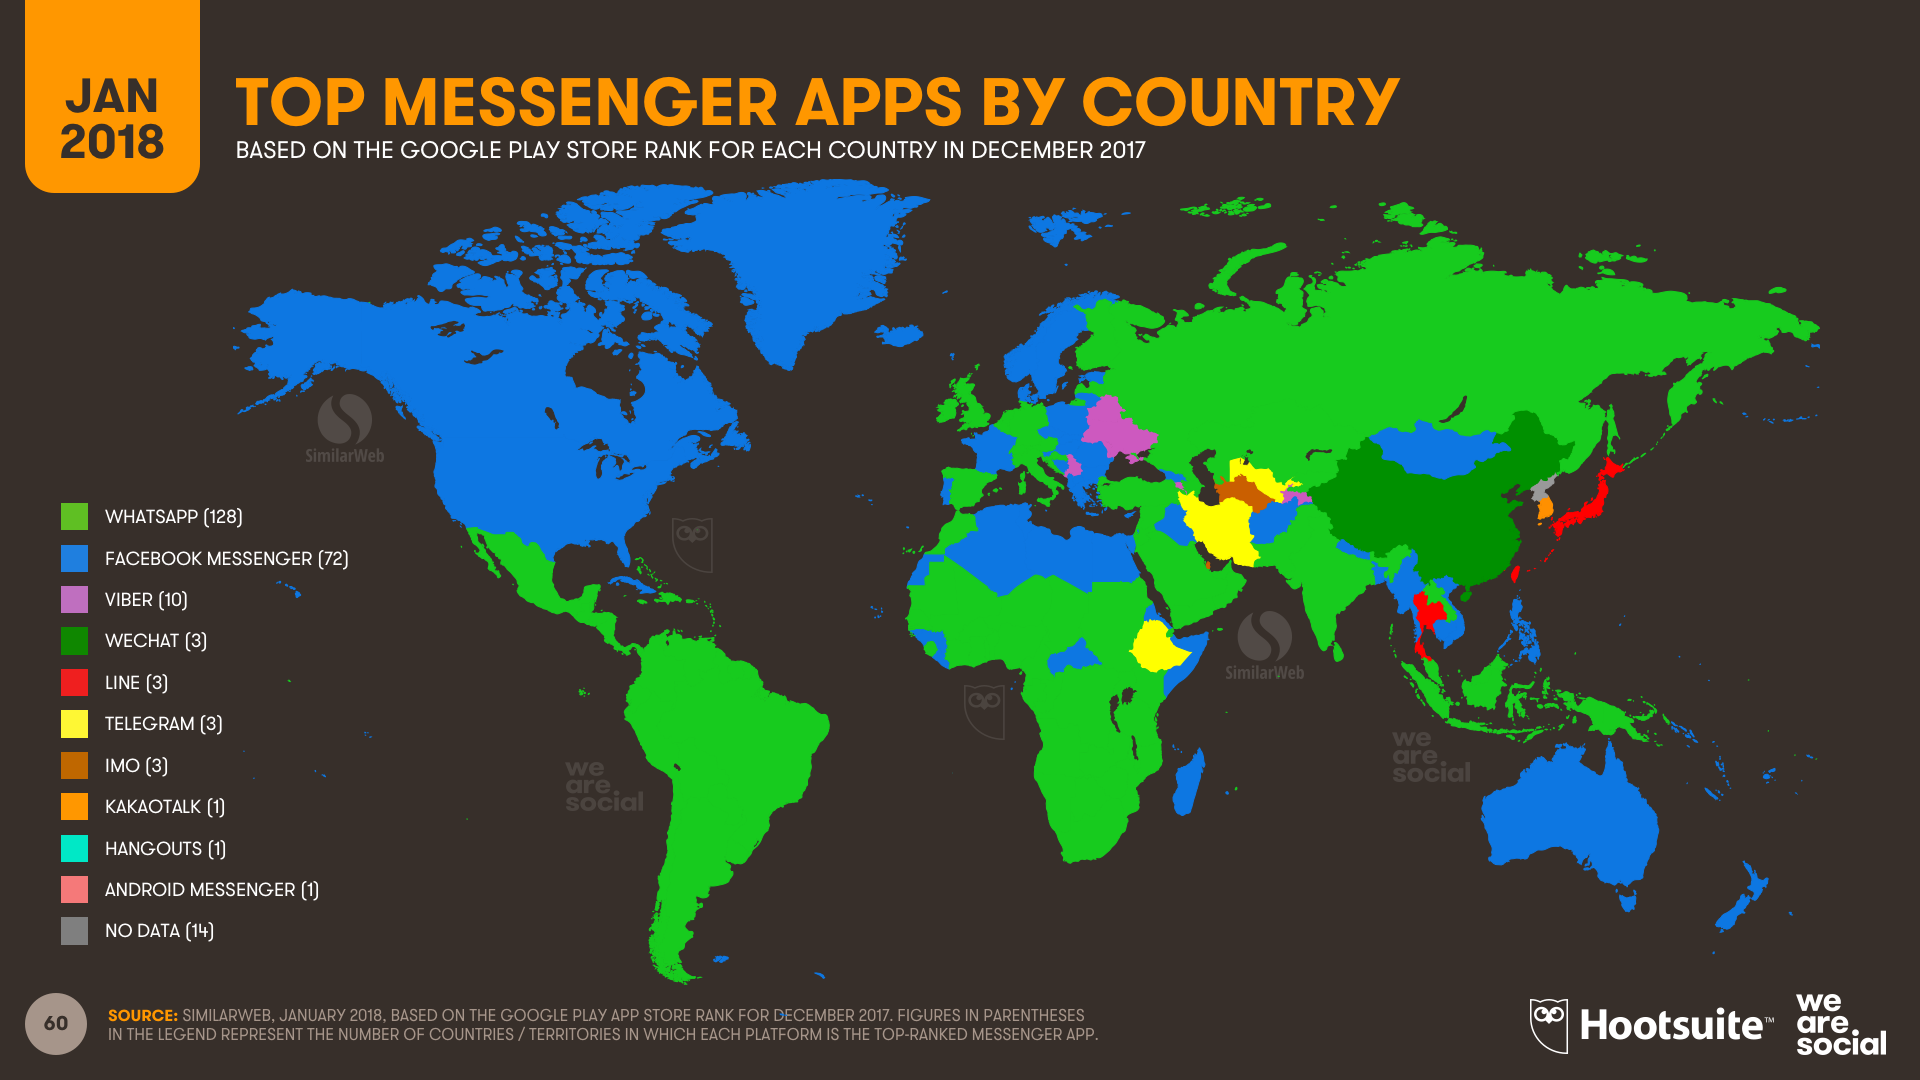
Both apps are still tied in terms of user numbers, but the latest data from SimilarWeb shows that WhatsApp has the stronger geographic position. WhatsApp is now the top messenger app in 128 countries around the world, compared to Facebook Messenger’s 72 countries.
There are now only 25 countries around the world where a Facebook-owned app isn’t the top messenger platform.
Despite these impressive messenger stats though, Instagram managed to claim Facebook Inc.’s standout growth story over the past 12 months, with the number of global users up by a third.
To help businesses everywhere quantify the Instagram opportunity in their respective countries, we’ve included local numbers for Instagram use across more than 230 countries in this year’s regional reports. You’ll find links to those at the end of this post.
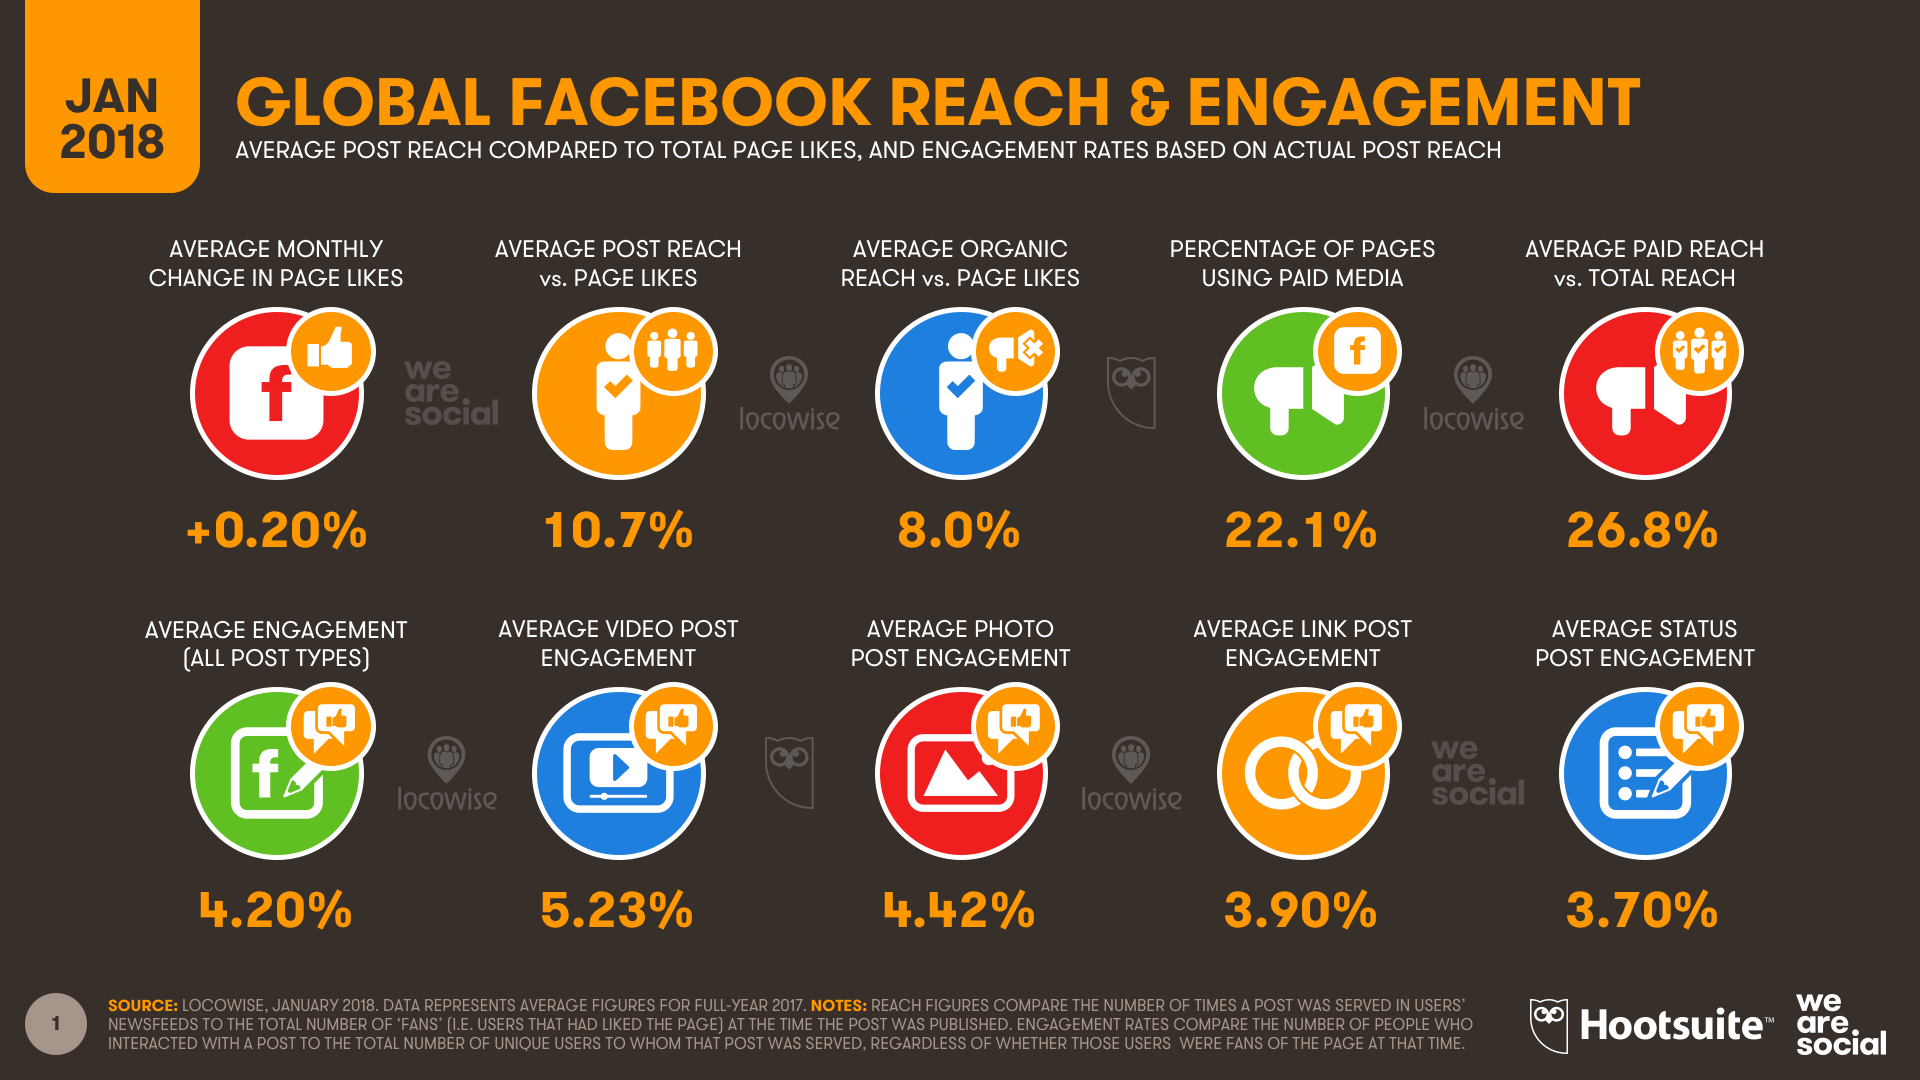
7. Organic reach continues to fall
For this year’s reports, we’ve teamed up with Locowise to share details of Facebook reach and engagement for 179 countries around the world.
As expected, organic reach and engagement have both dropped over the past year, with average reach down by more than 10 percent year-on-year.
Despite the depressing trends, these numbers will be valuable benchmarks for marketers everywhere – especially because they offer insights into the number of brands using paid media.
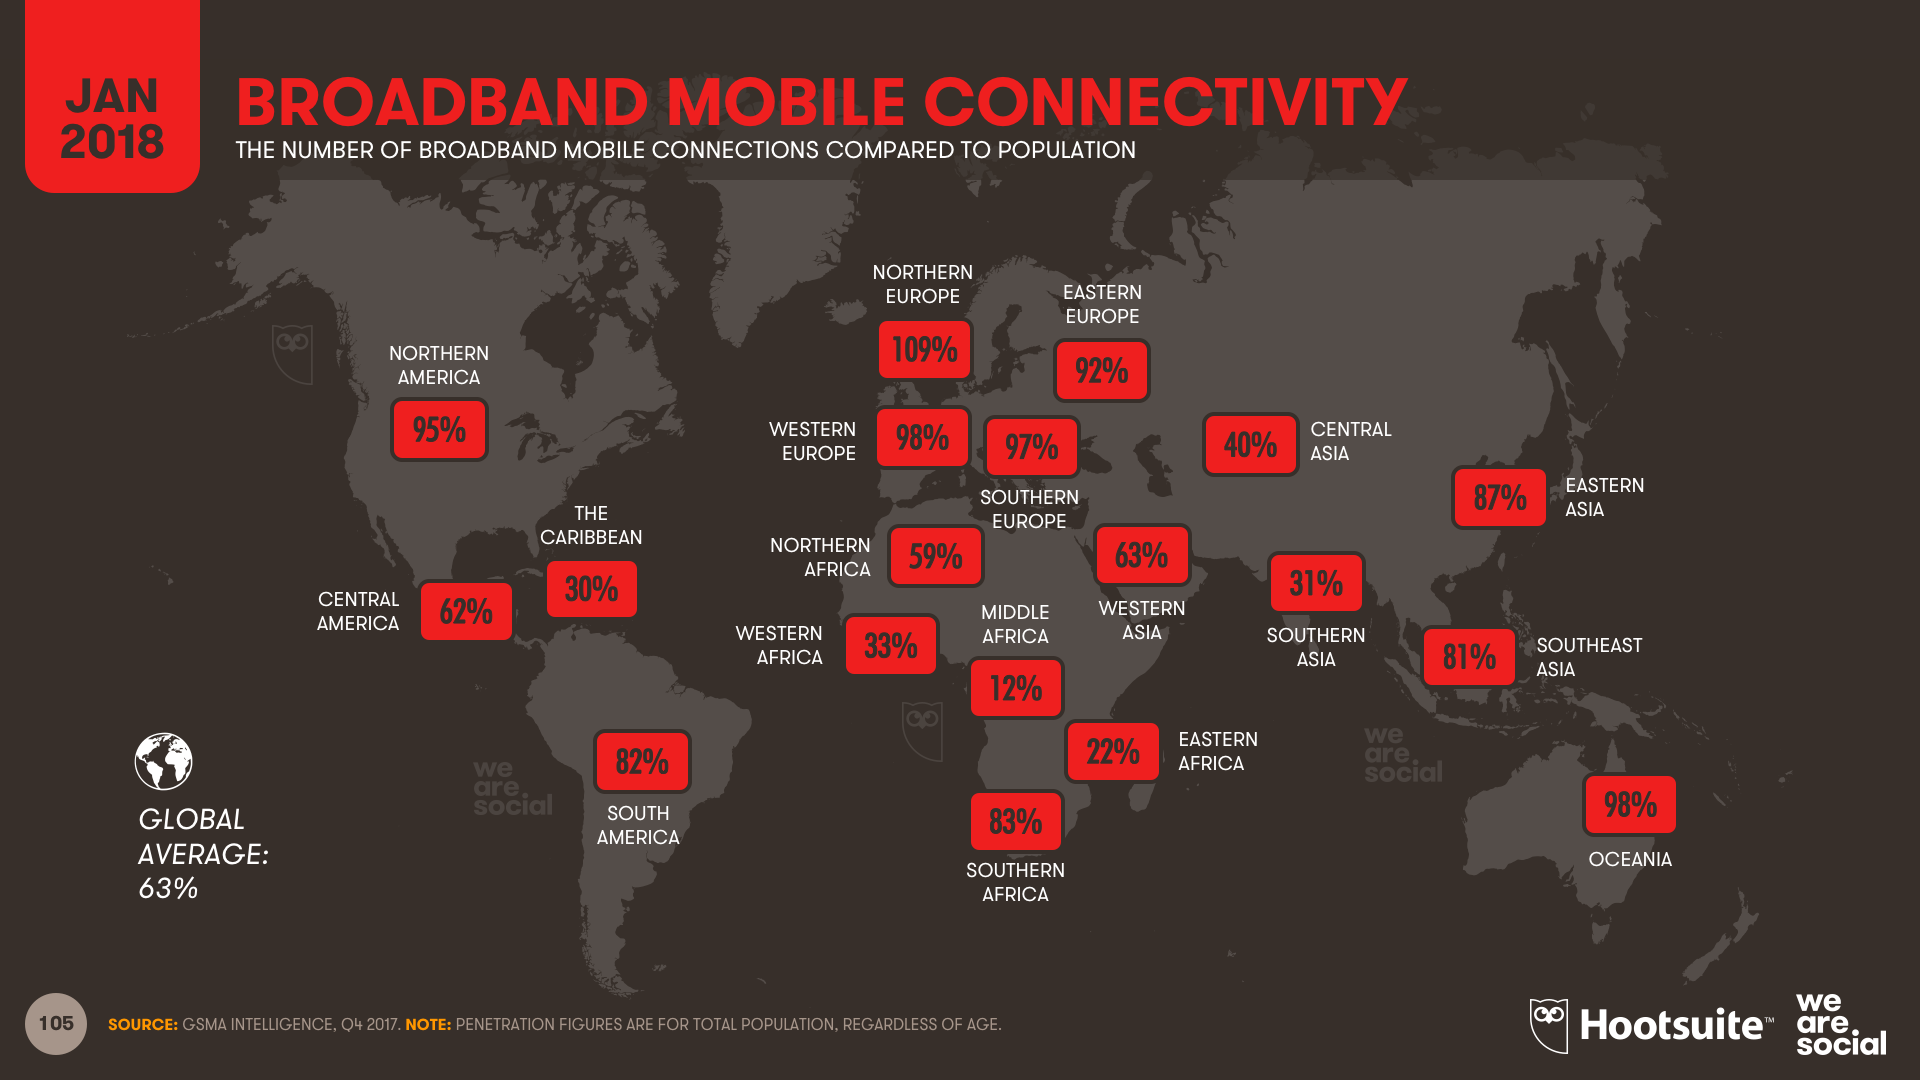
8. Mobile connection speeds increase
Mobile data connections are getting faster all over the world, with GSMA Intelligence reporting that more than 60 percent of mobile connections can now be classified as ‘broadband’.
However, there are significant differences in mobile connection speeds between countries. Mobile users in Norway enjoy average download speeds of more than 60 Mbps; almost three times the global average.
Mobile users in 6 countries – including the Netherlands, Singapore, and the UAE – now enjoy average connection speeds of more than 50 Mbps. At the other end of the spectrum, mobile users in 18 countries – including India and Indonesia – still suffer from average connection speeds of less than 10 Mbps.
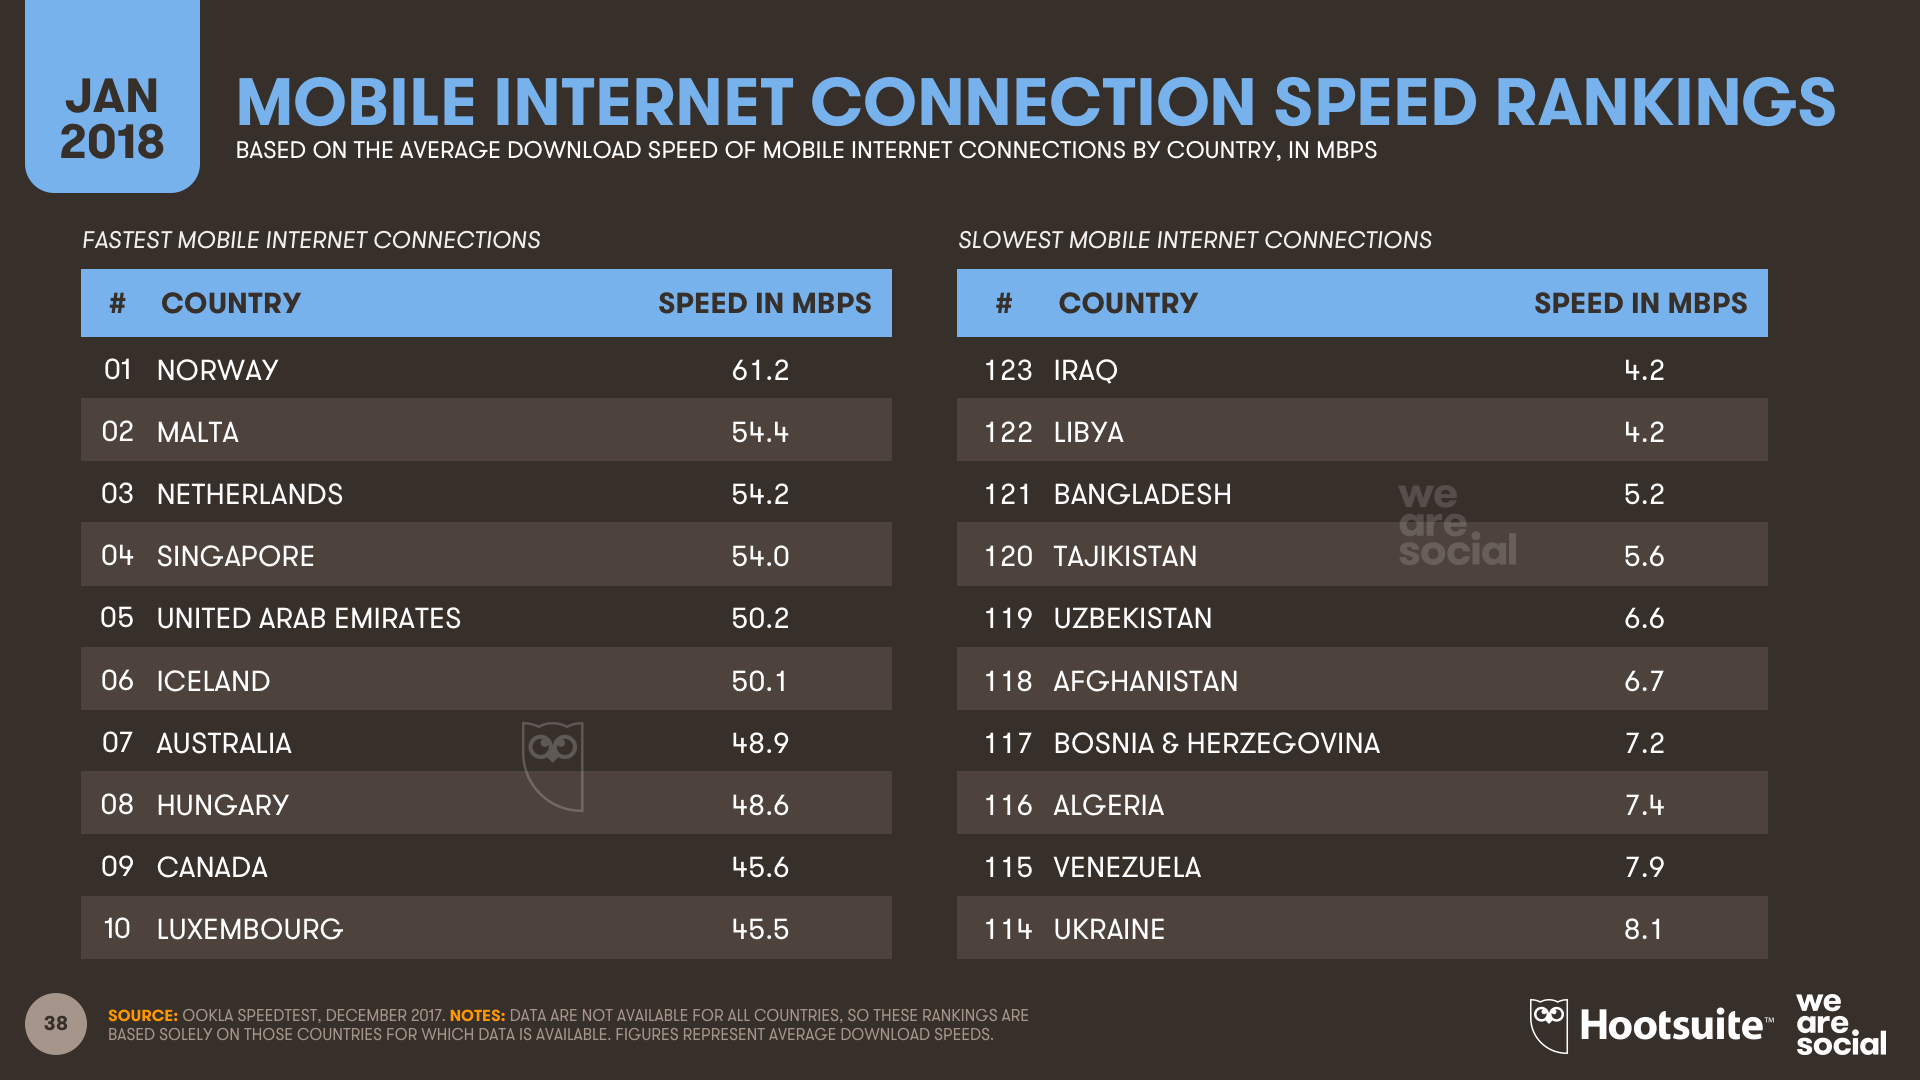
There is good news, though: average mobile connection speeds increased by more than 30 percent over the past year.
This isn’t just good news for the impatient, either; faster connections may also help to reduce stress. Research has shown that delays of just a few seconds while buffering video content can trigger the same increase in anxiety levels as watching a horror movie on your own, or trying to solve a complex math problem.
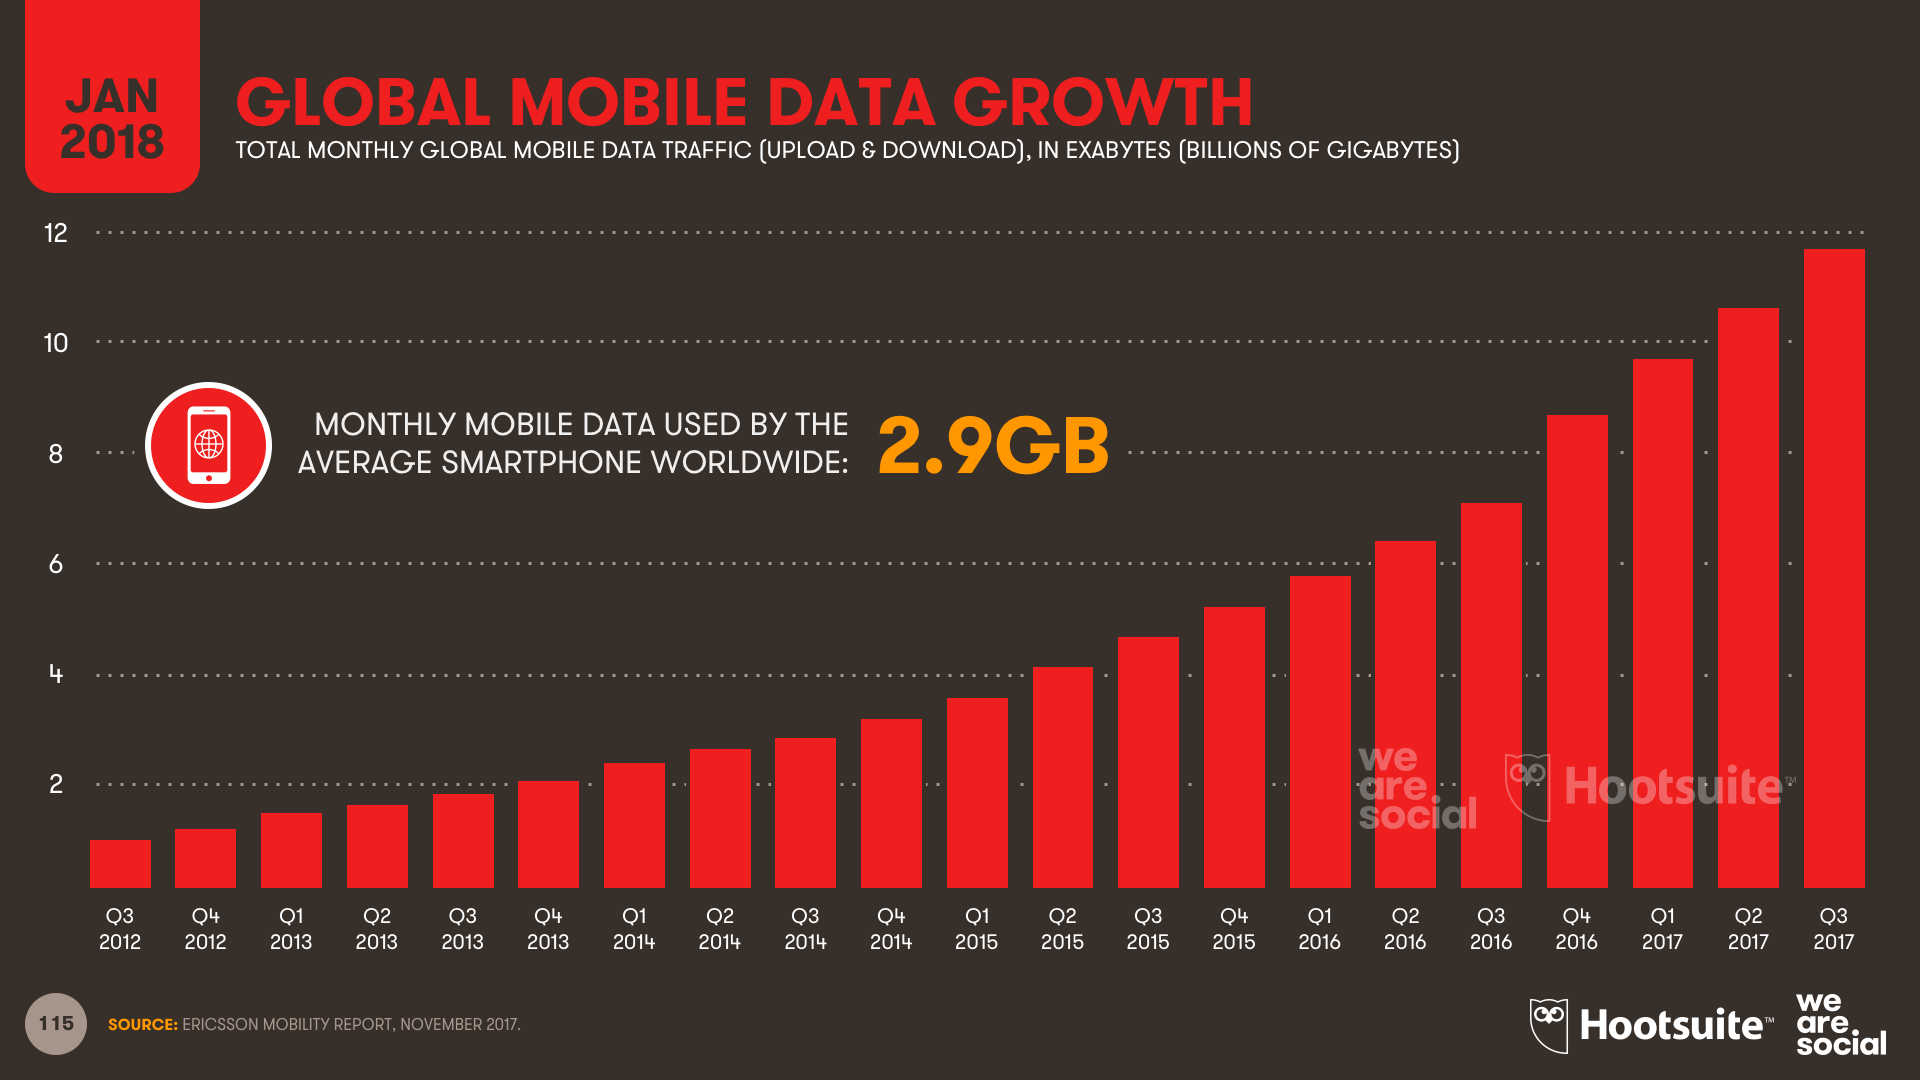
Partly thanks to these faster download speeds, the average smartphone user around the world now consumes almost 3GB of data every month – an increase of more than 50 percent since this time last year.
9. E-commerce spend jumps
The latest data from Statista’s Digital Market Outlook shows that the total value of the e-commerce market for consumer goods grew by 16 percent over the past year. Total annual spend in 2017 reached almost US$1.5 trillion, with fashion products representing the largest single category.
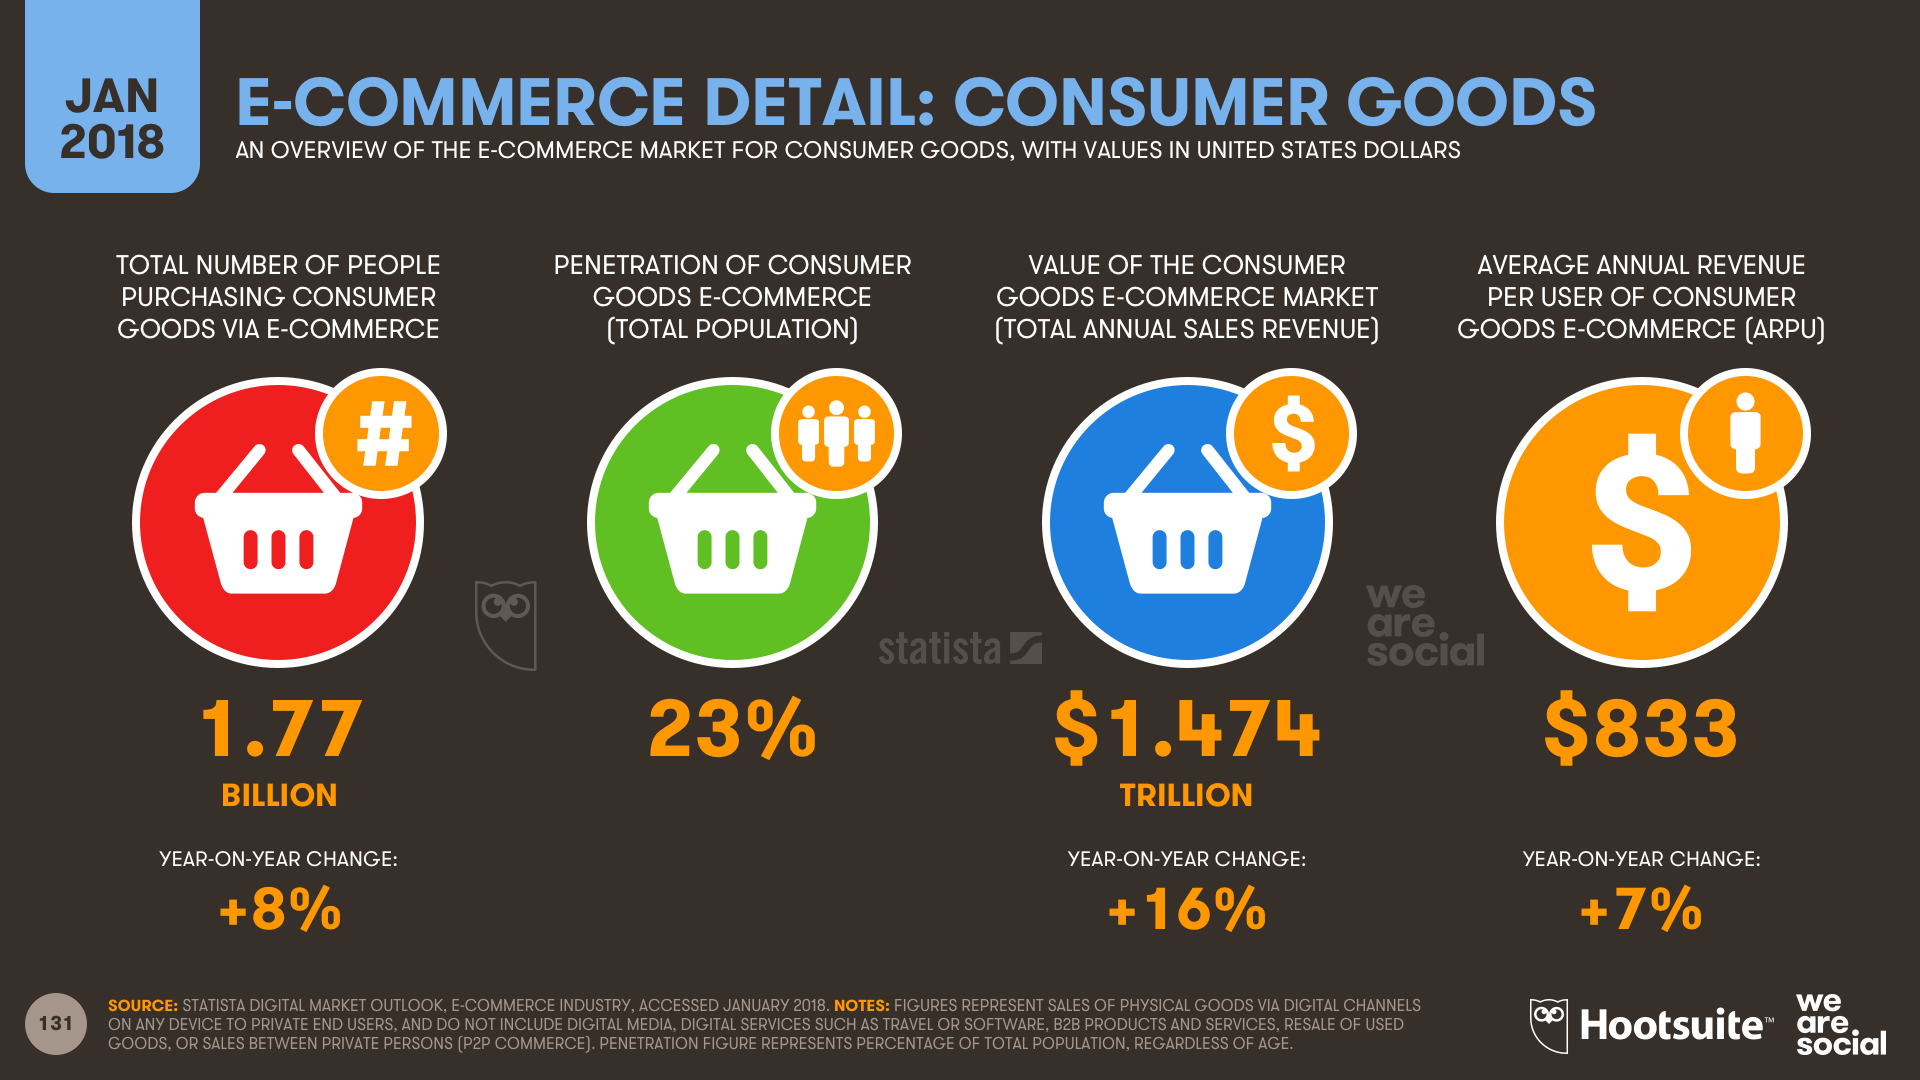
Worldwide, the number of people using e-commerce platforms to buy consumer goods (e.g. fashion, food, electronics, and toys) grew by 8 percent, with almost 1.8 billion people around the world now buying online.
Roughly 45 percent of all internet users now use e-commerce sites, but penetration varies considerably between countries.
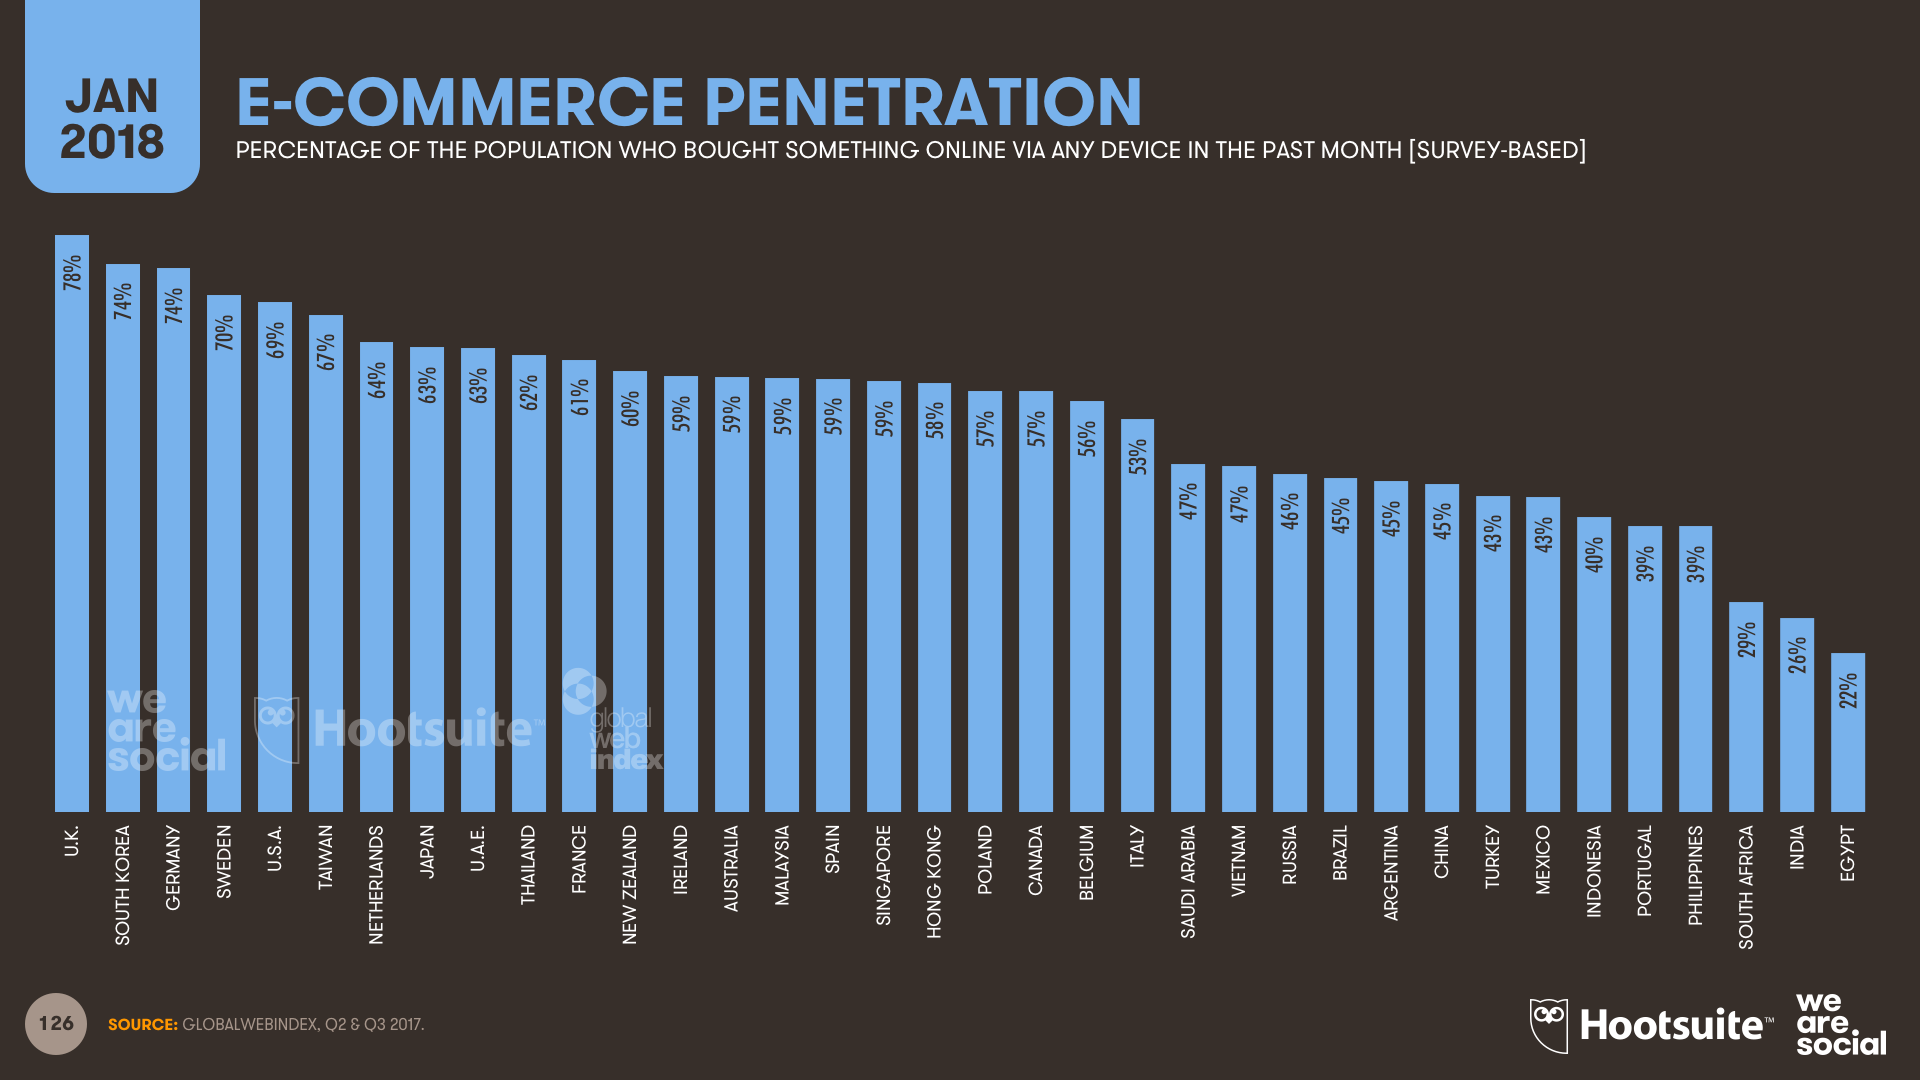
The amount that each person spends on e-commerce is also growing, with average revenues per user (ARPU) up by 7 percent year-on-year to reach US$833. The British are the biggest e-commerce spenders, with annual spend in the UK now greater than US$2,000 per user.

It’s worth highlighting that these are just the figures for consumer goods too; if we add spend on other categories such as travel, digital content, and mobile apps, total global e-commerce value is likely to be closer to US$2 trillion.
10. 5,000 charts
This post only includes a small selection of the data you’ll find across the 5,000 charts in our complete suite of 2018 Global Digital reports.
In particular, you’ll find in-depth data for more than 230 countries and territories in our various regional reports, including all the essential numbers you need to understand internet, social media, and mobile behaviours all over the world.
In the meantime, I hope these reports inspire lots of valuable new ideas, and they help you towards another successful year in digital in 2018.
Source: LinkedIn