
For newspapers, 2015 might as well have been a recession year. Weekday circulation fell 7% and Sunday circulation fell 4%, both showing their greatest declines since 2010. At the same time, advertising revenue experienced its greatest drop since 2009, falling nearly 8% from 2014 to 2015. Fully one-fourth of advertising revenue now comes from digital advertising, but not because of growth in that area: Digital advertising revenue fell 2% in 2015. It’s just that non-digital advertising revenue fell more, dropping 10% in 2015. In 2014, the latest year for which data were available, newsroom employment also declined 10%, more than in any other year since 2009. The newspaper workforce has shrunk by about 20,000 positions, or 39%, in the last 20 years. And three newspaper companies – E.W. Scripps, Journal Communications, and Gannett – are now one, reflecting a trend toward consolidation in the industry. Nevertheless, most of the newspaper websites studied here experienced growth in traffic, and mobile traffic in particular. Overall, however, the industry continues to shrink, with Editor & Publisher’s DataBook listing 126 fewer daily papers in 2014 than in 2004.
Audience
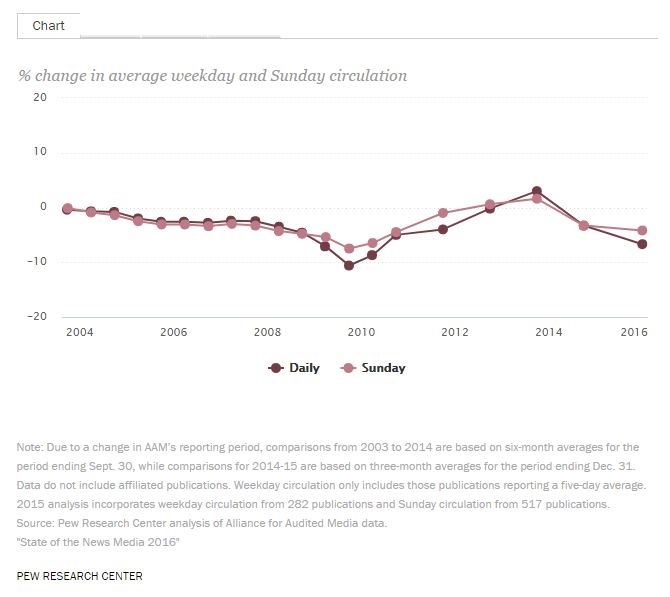
Weekday circulation experienced a decline not seen since the immediate aftermath of the Great Recession. Average weekday circulation fell 7%, the most since 2010. This drop was due entirely to print circulation, which declined by 9%, while digital circulation increased by 2%.1 Sunday circulation, meanwhile, fell 4%, following a 3% decrease in 2014. As with weekday circulation, the fall in Sunday circulation was due to a decline in print circulation, which fell 5% while digital rose 4%.2 For both weekday and Sunday circulation, the fall represents a continuation of the trend that began in 2014. After 2009, circulation seemed to be cutting its losses, even showing a small increase in 2013. But after a decline of 3% in both weekday and Sunday in 2014, 2015 saw circulation fall even more rapidly.
Newspaper circulation declines for second consecutive year in 2015
Amid these declines, print remains a vital part of newspapers’ distribution picture. In 2015, print circulation makes up 78% of weekday circulation and 86% of all Sunday circulation. Only three newspapers had more average weekday digital circulation than average weekday print circulation in the same period.
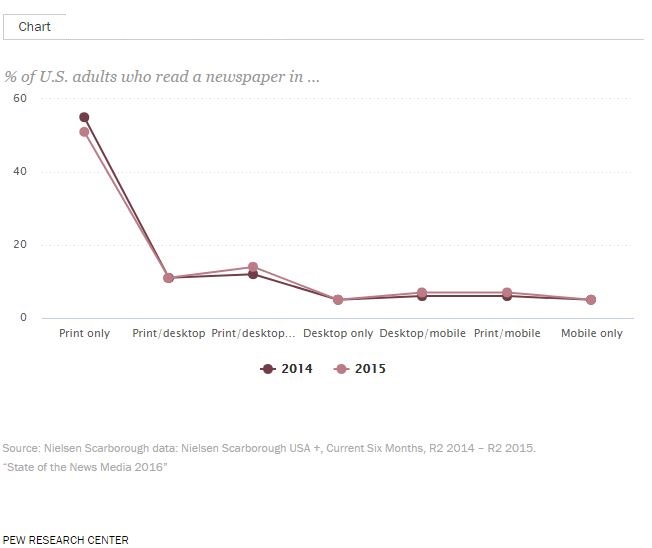
Survey data reinforce the heavy reliance on the print product. Similar to what we found in our analysis of news habits in three U.S. metropolitan areas, national readership data from Nielsen Scarborough’s 2015 Newspaper Penetration Report indicate that 51% of those who consume a newspaper read it exclusively in print, while just 5% read it on desktop only, 5% read it on mobile only and 7% read it on both mobile and desktop. There has been some shift over time, from 62% print-only readership in 2011 and 59% in 2012 – but print is still the main form for these audiences.
Print-only still most common way of reading newspapers
However, in the modern era, looking at newspaper subscribers as the only readers of newspaper content misses an important part of the story. The share of newspaper readers who report reading a newspaper in digital form, or who have digital subscriptions, is not the same as the share of Americans more broadly who come across individual stories hosted on a newspaper’s website as they surf the web. The findings reported above are based on survey questions asked of individuals who self-reported reading a newspaper online or in print in the past 30 days. However, it does not include everyone who lands upon a newspaper website while searching for news information or following a link from an email or social networking post. These consumers of individual bits of information may not remember having read a newspaper, or have even realized that they did. (We have found that most people who read an article on a website do not read any other articles on that site in a given month, suggesting that this kind of incidental readership is common.) Indeed, as revealed in the digital audience section below, when it comes to all newspaper website visitors – not just subscribers – the newspapers analyzed all had more digital traffic than print subscribers.
The reliance on print among dedicated newspaper audiences is especially problematic as the portion of Americans turning to print newspapers continues to decline, given that in 2015, 75% of newspapers’ advertising revenue came from non-digital sources. A recent Pew Research Center survey found that 36% of U.S. adults learned something about the election in the past week from a print newspaper. This was lower than the portion that learned from radio (44%), digital sources (65%) or television sources (78%). We also recently found that the portion of adults who often get news from print newspapers (20%) falls behind those who learned from radio (25%), news websites and apps (28%) and all forms of television. Until a decade ago, however, newspapers outranked radio and the internet as the public’s main source of news.
In other words, the share of Americans getting news on legacy platforms is falling behind those of most other platforms, including radio – but the industry seems not to have found a way to persistently capture that audience online.
Economics
In 2014, the Newspaper Association of America (NAA) stopped releasing industry-wide revenue data. Its last reported figure was total revenue in 2013 of $37.6 billion, with $23.6 billion in ad revenue and $10.9 billion in circulation revenue. Since then, it has become necessary to come up with a proxy that helps give a sense of the industry. One way of doing this is to examine revenue data from publicly traded newspaper companies (whose number has declined from nine to seven over the past 10 years,3 representing about a quarter of all U.S. daily newspapers) – which are legally bound to release these figures. This cannot be used to calculate a total revenue amount for the industry as a whole, but it can provide a good indication of year-over-year changes.
Advertising revenue sees biggest drop since 2009
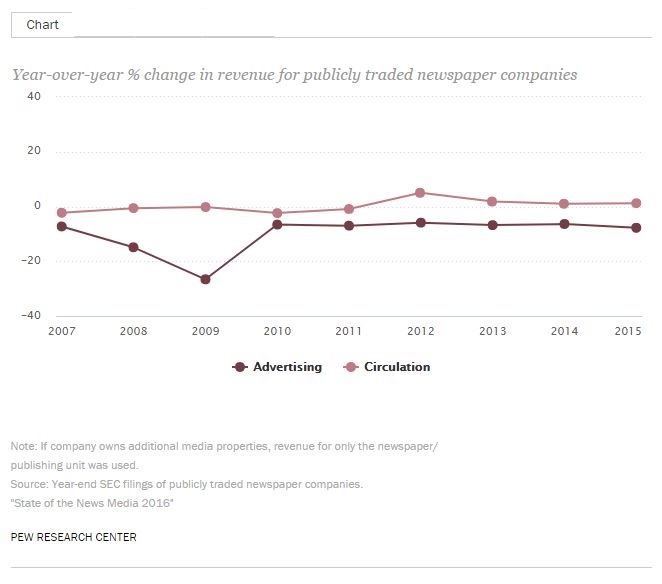
In 2015, these companies experienced their greatest decline since the recession years of 2008 and 2009. In 2015, advertising revenue fell 8%, while circulation revenue was stable (up 1%). Prior to 2008, the largest reported drop was in 2001, when advertising revenue fell 9%. The decline in 2015 was nevertheless far less than what was seen in 2008 (-15%) and 2009 (-27%).
This change was particularly pronounced at Gannett, where advertising revenue fell 12% (from $1.8 billion to $1.6 billion) and circulation revenue fell from $1.11 billion to $1.06 billion, a 5% decline. At McClatchy, advertising revenue fell 13% (from $732 million to $637 million) but circulation revenue was stable, rising from $367 million to $368 million. The New York Times Co. also saw advertising revenue fall (by 4%), though their circulation revenue was stable ($837 million to $846 million).
A quarter of advertising revenue comes from digital
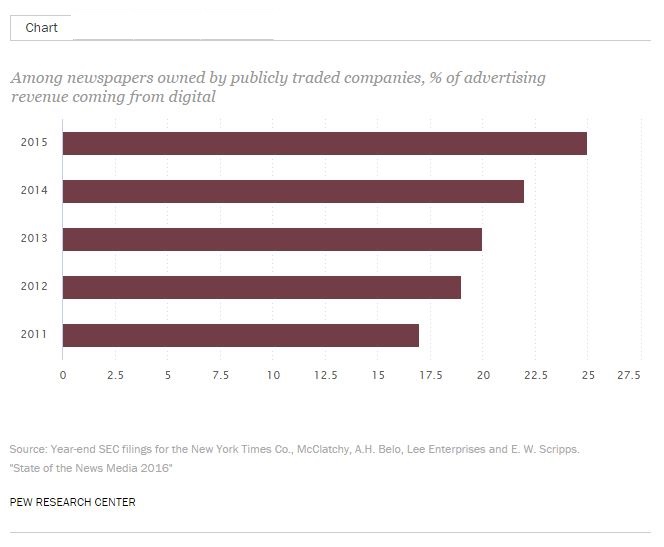
Digital revenue is making up an increasingly large portion of publicly traded newspaper companies’ ad revenue, though this has more to do with the decline of print revenue than the growth of digital. Again, however, since we do not have industry-wide figures, we need to rely on data from the five publicly traded companies that broke out digital vs. non-digital ad revenue in their SEC filings. Among those companies, one in every four dollars of ad revenue in 2015 came in the form of digital, a small bump up from 2014 and a sizable rise from the 5% of ad revenue digital sources made up in 2006. Gains in digital ad revenue, however, have not made up for the continued decline in print revenue. For the five companies that broke out digital vs. non-digital ad revenue for 2014-2015, non-digital ad revenue declined 9.9%, while digital’s decline was less steep (-1.7%). (The remaining companies did not provide a digital/non-digital breakdown in their SEC filings.)
Digital ad revenue declined at Tribune Publishing, from $205 million to $192 million (-6%), and at Gannett, from $447 million to $424 million (-5%). It showed a 7% gain at Lee Enterprises (from $76 million to $82 million), and an 8% gain at The New York Times Co. (from $183 million to $198 million). At A.H. Belo, it was about steady (-1%). All companies saw their non-digital ad revenue decline.
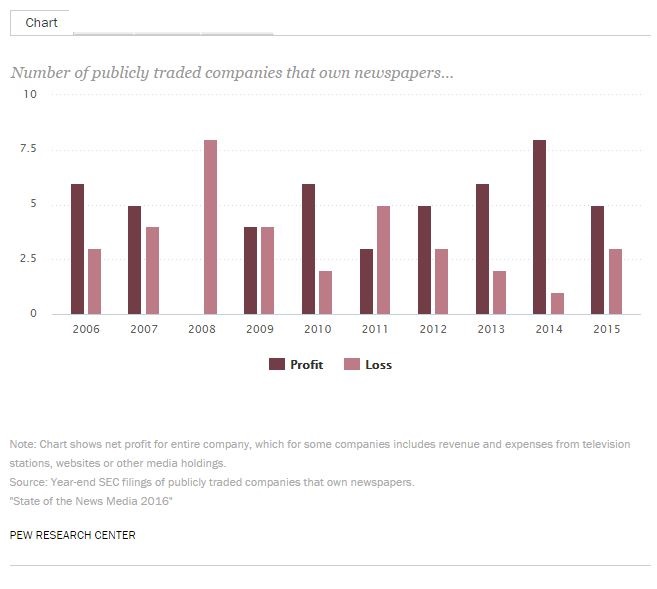
One way to address falling revenue is to cut costs. The success of this would be reflected in the net profit seen by newspaper companies. On this front, while there is some evidence that newspapers have been able to offset losses in circulation revenue by cutting costs, on the whole, 2015 appears to be a more difficult year for the industry than 2014. Five of these public companies showed a profit for 2015, while three did not. That is a change from the two years prior, when eight and six companies showed a profit, respectively.
More newspaper companies saw a loss in 2015
News investment
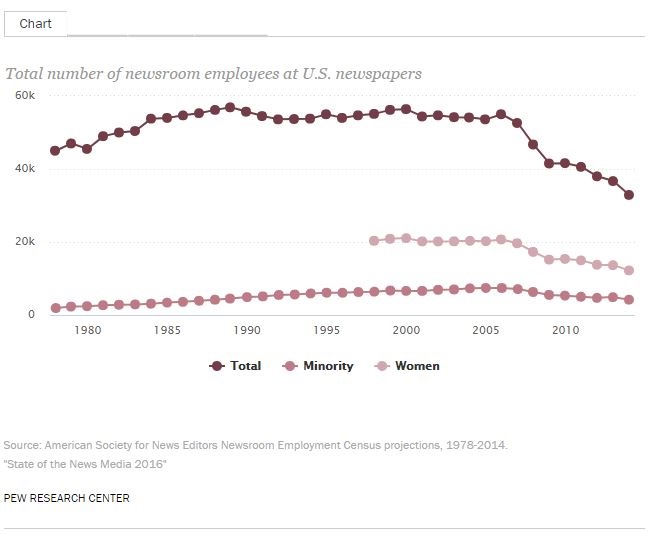
The overall newsroom workforce experienced its sharpest decline since 2009. According to the American Society of News Editors’ Newsroom Employment Census, after falling 6% in 2012 and 3% in 2013, overall newsroom employment was down 10% in 2014 – the most recent year for which figures are available – to 32,900. Between 1994 and 2014, the profession has shed over 20,000 jobs, representing a 39% decline.
Newsroom employment continues to fall
While ASNE will not release 2015 figures until later in 2016, it is likely that 2015 will also experience a noticeable decline. Major staff cuts occurred between April of 2015 and spring 2016 at the Philadelphia Inquirer and Daily News, Tribune Publishing (including the Los Angeles Times and the Chicago Tribune), the Wall Street Journal, the New York Daily News, the San Diego Union-Tribune, the Orange County Register, McClatchy’s foreign bureaus, the Seattle Times and Newsday, the Denver Post and the Boston Globe. (Globe editorial employees also spent one Sunday helping to deliver the paper.)
The number of female newsroom employees fell at roughly the same rate as newsroom employment overall (11%). Women have made up 36-38% of newsroom employees since ASNE began measuring their employment in 1998. The percentage of minority employees remained steady at 13%. A report this year found a persistent wage gap by gender and race at The Wall Street Journal and Dow Jones, one that is common across newspapers.
Ownership
After a year of media companies spinning off their newspaper units into stand-alone companies, the newspaper industry saw a wave of consolidation between spring 2015 and spring 2016. E.W. Scripps and Journal Communications, both of which had been spun off as newspaper-only units from larger media conglomerates, merged into a new company called Journal Media Group. The merged company was then purchased by Gannett, itself newly a stand-alone newspaper company after Gannett’s television and digital holdings were incorporated as TEGNA. Meanwhile, a deal to sell Digital First Media as a whole fell through, and the company instead sold 11 papers to Gannett. And New Media Investment Group continued its string of acquisitions, with more planned.
Tribune Publishing, owners of the Chicago Tribune and the Los Angeles Times, purchased The San Diego Union-Tribune in the spring of 2015, but by August, the company’s stock price had fallen 51% since the company was spun off from Tribune Media in August 2014. Subsequently, it rejected a purchase offer for the L.A. Times, prompting protests from the city’s civic leaders, and in November News Corp. founder Rupert Murdoch suggested the company as a whole might be up for sale. Following this turmoil, Tribune removed its CEO, Jack Griffin. Uncertainty over Tribune’s future continues, however, most recently with Gannett’s public takeover bid in April 2016.
Freedom Communications, owners of The Orange County Register and other papers, faced a series of setbacks in 2014 and filed for bankruptcy in 2015. In the resulting auction, Tribune Publishing initially came out on top, which would have given it control of three major dailies in Southern California. Instead, the Department of Justice raised antitrust concerns with the sale, and Tribune bowed out – paving the way for Digital First Media to make the purchase instead.
Not all purchases saw their details made public. The Las Vegas Review-Journal was acquired from Gatehouse Media by a newly created private investment group, and at first even the paper’s own employees didn’t know their new owner’s identity. After it became known that the investment group was controlled by the family of casino owner Sheldon Adelson, the paper’s editor stepped down in protest. Elsewhere, the major Philadelphia newspapers reorganized under a new nonprofit. And in New York, the Daily News was up for sale, but they were carrying so much debt that Cablevision wouldn’t even agree to purchase at a price of $1. In sunnier news, The Washington Times had its first profitable month in 33 years. Overall, however, the value of newspaper companies has declined.
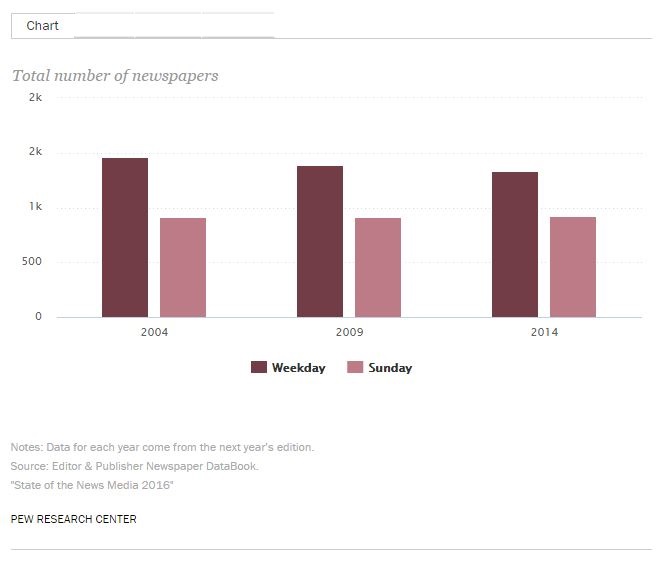
Several papers closed for good, including the Oakland Tribune and The Cheraw Chronicle. Editor & Publisher’s Newspaper DataBook identified 1,331 daily newspapers in the U.S. in 2014 (the most recent year for which data are available), down from 1,457 in 2004.
The number of daily newspapers has decreased by more than 100 since 2004
Digital
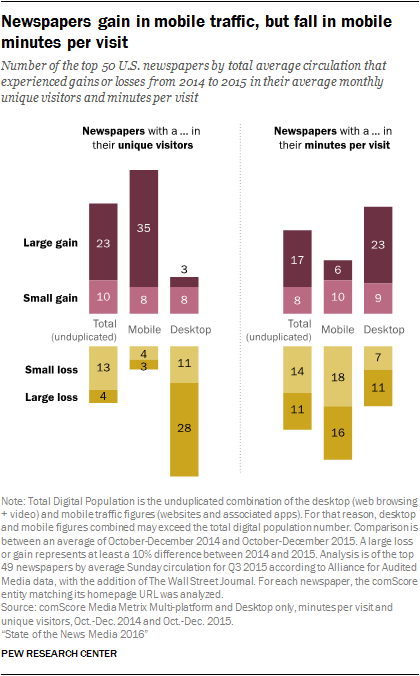
In 2015, the online audience for newspapers continued its shift to mobile devices. Unique visitors rose from 2014 to 2015 for a majority of the top 50 U.S. newspapers, while average minutes per visit rose for half of the 50. However, both of these measures differed between desktop and mobile traffic. For 39 of the 50 newspaper websites examined here, the number of unique visitors on desktop fell, with 28 showing a drop of at least 10%. Conversely, unique visitors on mobile rose for 43 of the 50, with 35 showing a 10% or greater increase.
The opposite was true for time spent, as minutes per visit on a mobile device fell even as unique mobile visitors grew. Though average monthly minutes per visit rose overall for 25 of the 50 newspapers, minutes per visit on desktop rose for 32, and by 10% or more for 23 of these. Time spent on mobile, however, fell for 34.
As in 2014, mobile traffic outpaced desktop traffic by a considerable margin. For 44 of the 50 papers, mobile unique visitors exceeded desktop unique visitors by at least 10%. And just as in 2014, time spent on desktop was generally greater than time spent on mobile. For 41 of the 50 papers, average time spent per visit on desktop was 10% or greater than average time spent on mobile. This is true of internet usage more broadly – but for the total U.S. internet audience, there are generally more desktop visitors per month than mobile visitors.
As mentioned above, newspapers’ web traffic outpaces their circulation by a substantial margin. For the 49 of these U.S. papers reporting Sunday circulation (The Wall Street Journal does not publish a Sunday edition), average monthly unique visitors for the third quarter of 2015 was anywhere from two to 78 times greater than average Sunday circulation for the same period.4 This is the case despite the fact that more people self-report reading newspapers in print than in a digital form. This points to the difficulty of diagnosing the digital health of newspapers. Web traffic is high, but a reader who stopped by for only one article may be counted the same as a subscriber who visited daily. Clearly, however, many of these one-time visitors do not think of themselves as newspaper readers – and, indeed, single-article visitors may only stay for a short amount of time, while subscribers could spend considerably more time on the site in a month. The challenge for newspapers, then, is to convert these grazers into loyal readers.
One new reality of the digital age is that some foreign papers have established themselves with American audiences, especially ones from the UK. Indeed, many are accessed as often as some American papers by U.S. internet users, even though Americans largely do not have access to print editions of these papers. U.S. web traffic coming to dailymail.co.uk or theguardian.com (measured in terms of unique visitors) would place them within the top five U.S.-based newspapers by web traffic, while telegraph.co.uk and independent.co.uk would rank in the top 10. The top 50 would include papers from Australia, Canada, India, Ireland and New Zealand.
One area of added momentum has been around experimentation with new digital approaches. In 2015 and 2016, these ranged from virtual reality and chatbots to new distribution methods and embracing metered paywalls. Internationally, both the UK’s The Independent and Canada’s La Presse mostly dropped their print editions and went online-only, with La Presse putting a particular focus on their tablet edition, while Turkish papers responded to a government shutdown by publishing on Twitter. Local papers’ efforts to attract online audience included video and big multimedia features. And, like other news organizations, newspaper companies considered how to address the new wave of ad-blocking technology. There were some notable successes in the digital realm: The New York Times reached a million digital-only subscribers, while The Washington Post massively increased its web traffic.
Source: Pew Research Center