


Here’s your latest roundup of Asia-Pacific digital marketing stats, with some great research on ecommerce, payment, industry salaries and adspend.
You can get even more in Econsultancy’s Internet Statistics Compendium. On we go…
The incredible rise of online shopping in India
Credit Suisse has released its annual emerging markets report, namely Brazil, China, India, Indonesia, Mexico, Russia, South Africa and Turkey. I’m going to pick out some of the most interesting findings from the survey of 14,000 consumers.
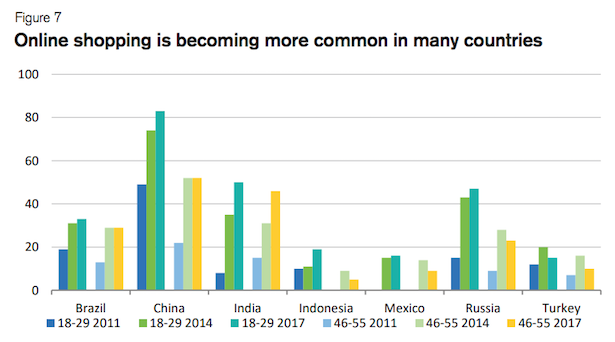
Firstly, take a look at the complicated chart below. Once you get your head around it, it demonstrates three things:
- The extent to which popularity of online shopping is increasing in emerging markets.
- The incredible rise of online shopping in India (e.g. from <10% amongst Indian 18-29 year olds in 2011, to 50% of the same demographic in 2017).
- The disparity between online shopping penetration amongst young and older demographics.

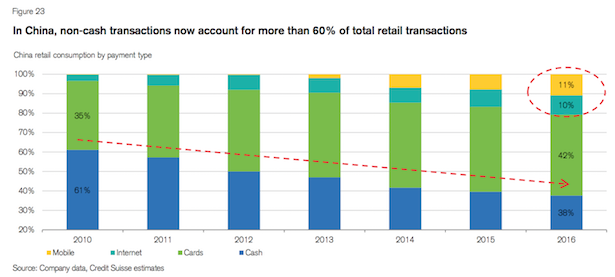
China cash payments down from 60% of total retail transactions to just 38% in six years.
This chart from the same emerging markets survey shows how China retail payments have changed from 2010 to 2016. Incredibly, cash payments are down from 60% of total retail transactions in 2010, to just 38% in 2016.

More than 30% of online retail sales are cross-border in emerging markets of Brazil, Mexico, and India
Sticking with the same Credit Suisse survey, this chart shows how some emerging markets now see high levels of cross-border online sales in retail. Only Singapore sits above Brazil, Mexico, India, and Russia, each of which sees cross-border online retail sales of between 30-35%.


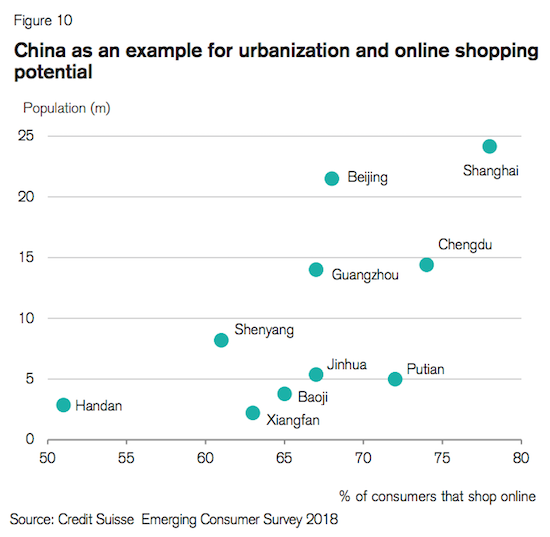
Urbanisation correlates with online shopping penetration
The last stat from that Credit Suisse survey now. The research showed that online shopping penetration in any given city correlates with the population of that city i.e. the more urbanisation seen, the more likely online shopping will take hold.
This is a fairly obvious thing to assert – building the required logistical network is a lot easier in a high-density city – but the data is still elegant. Have a look at the correlation for Chinese big cities in the chart below. It’s pretty striking.

Aussie online adspend up 7% to $7.9 billion in 2017
Though this is well down on the 23% increase of 2016, there are still big growth figures for mobile (+35%) and video advertising (+43%), revealed by the IAB/PwC Online Advertising Expenditure Report.

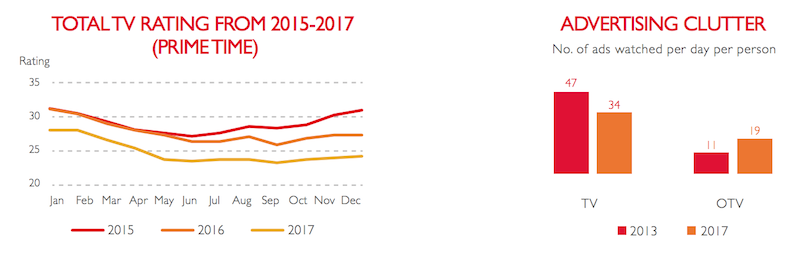
Chinese TV ratings decline and online TV ad clutter increases
OMD’s Transcend 2018 report about Chinese advertising shows that TV ratings have declined from 2015 to 2017, which has correlated with an increase in the number of ads viewers watch per day on online TV.
The report states that over this time, pre-roll ad duration has increased, more consumers have subscribed to video sites (to avoid ads) and as a consequence, there is still a premium on online video inventory and prime time TV inventory.

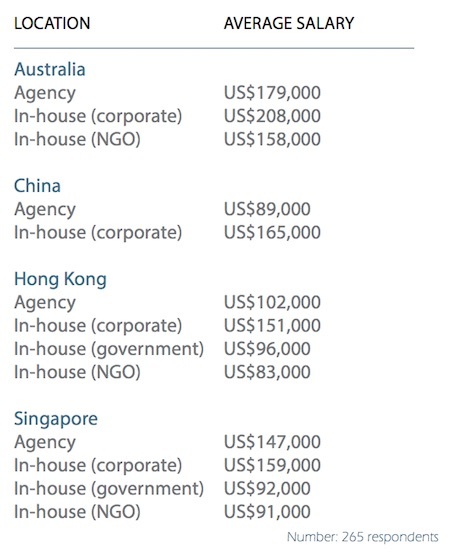
The gender salary gap in Asia-Pacific’s comms & corporate affairs industry
PublicAffairsAsia has produced its State of the Industry 2018 report, surveying 400 professionals in the comms and corporate affairs industry, largely from Hong Kong and Singapore.
A 5% increase in average pay was seen in 2017 with the regional average hitting US$141,000. National averages are shown in the table below.

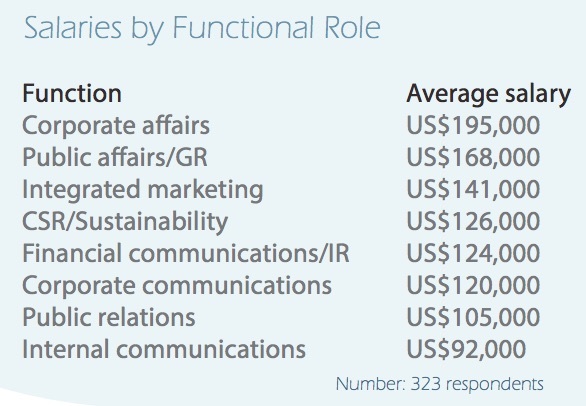
Averages by functional role vary quite a lot, with integrated marketers taking home $141,000.

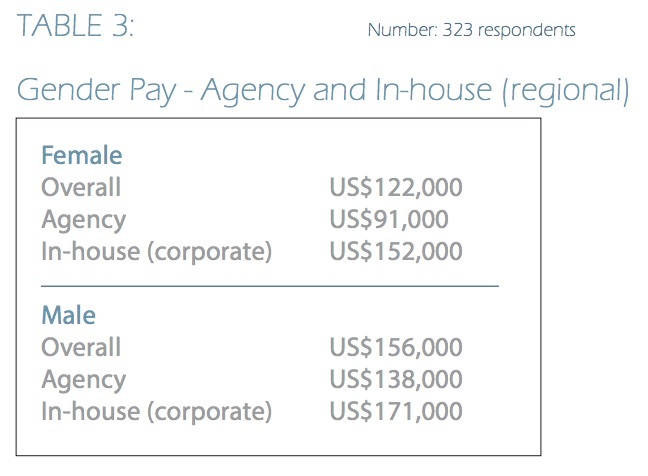
The average salary of men across the region is a full $19,000 more than that of women – at a national level, the gap is widest in China. There is also a higher average salary in-house than at agencies.

31% of Hong Kong advertisers have more funds for online marketing in 2018
The latest Hong Kong Advertisers Association Advertising Spending Projections 2018 survey, conducted by Nielsen, showed that total advertising spending in 2017 was HK$41.9 billion, 4% more than in 2016.
Online and mobile adspend accounted for 38% of all advertising spending, compared with 39% for TV and newspaper advertising combined.
33% of Hong Kong advertisers plan to increase adspend, and 31% said they had additional funding to support online marketing. However, the decline in the proportion of ad budget spent offline in 2017 in lower than that seen in 2016.
45% of APAC adspend is on digital, compared to 40% in other markets
Zenith’s ad expenditure forecast for March 2018 reveals that 45% of APAC adspend is on digital, compared to 40% in other markets. The growth of APAC adspend in 2018 is forecast at 6.2%.
The report also states that China is the world’s second biggest ad market, accounting for 15% of global adspend.
Source: Econsultancy