Search Engine Land’s Periodic Table of SEO Success Factors has been updated, with its fourth edition now available. It sees factors related to mobile, direct answers and site speed increase in importance. Factors related to search history have decreased. Factors related to site identity and personal social sharing have been dropped entirely.
Below is a further explanation behind the changes, along with a reintroduction to the table, for those who are new to it. For those who just want the latest table to download, scroll to the end.
The table’s goal & philosophy
Our goal with the Periodic Table of SEO Success Factors is to help publishers focus on the fundamentals needed to achieve success with search engine optimization.
To do this, the table doesn’t try to list all of Google’s 200 major ranking factors (most of which aren’t publicly known) or detail the search engine’s 10,000 subfactors. It doesn’t try to decipher if the keywords you want to rank for should be at the beginning of an HTML title tag or the end. It’s not about whether Facebook Likes count toward a ranking boost or not.
Rather, the table is intended to broadly guide both those new and experienced with SEO to focus on major areas of importance. Title tags are generally important; you should ensure they are descriptive. Social sharing is often generally seen as indirectly benefitting SEO. Aim for social shares, without worrying about the specifics.
To understand more about our philosophy behind the table, see our post from when the first edition debuted in 2011. You can also read how it changed with the second edition in 2013 and the third in 2015.
What the SEO table covers
There are two major classes of factors:
- On-the-page SEO: These are factors largely within the control of publishers.
- Off-the-page SEO: These are factors influenced by others or not directly tied to a publisher’s site.
Within these two classes are seven categories of factors, which are:
- Content — Factors relating to the content and quality of your material
- Architecture — Factors about your overall site functionality
- HTML — Factors specific to web pages
- Trust — Factors related to how trustworthy and authoritative a site seems to be
- Links — Factors related to how links impact rankings
- Personal — Factors about how personalization influences rankings
- Social — Factors on how social sharing impacts rankings
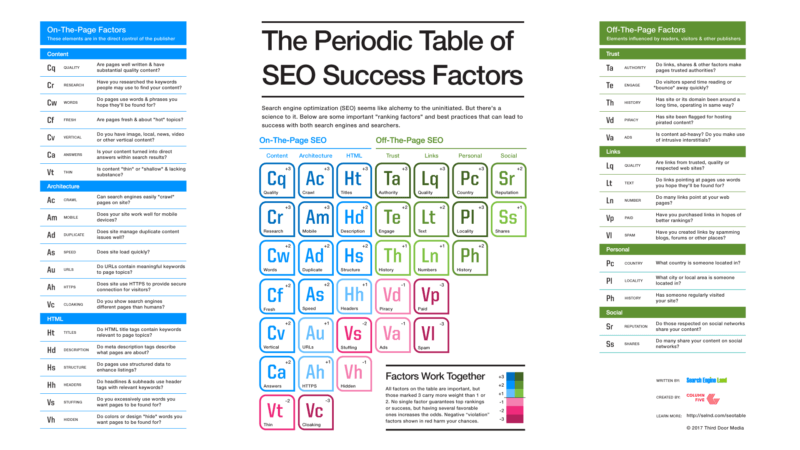
Overall, there are 35 individual factors, which range from making use of descriptive HTML title tags to whether a site has success with visitor engagement. Here’s a close-up of the table, focusing on just the factors:
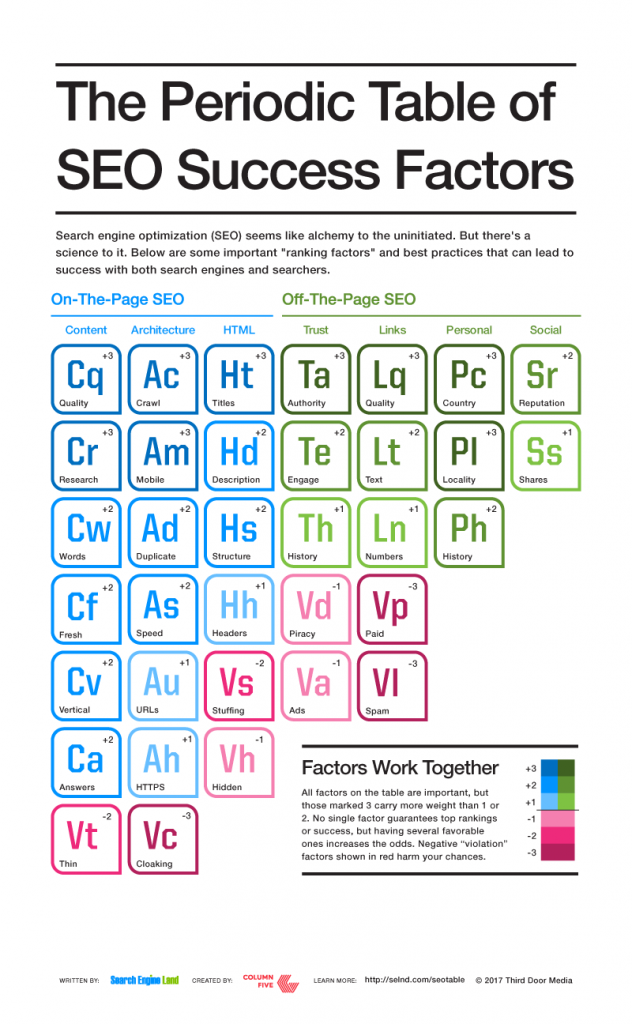
How to understand the table
Each factor has a two letter symbol. The first letter represents the category a factor is part of, such as “A” for Architecture. The second letter represents the element itself, such as “m” for Mobile, giving “Am” its symbol.
Each factor also has a weight. This is a relative guide to how important it is to focus on a particular factor versus others and overall. Those with a +3 are most important, with +2 and +1 indicating factors of lesser importance.
It’s also important to understand that the factors work together. No single factor guarantees success. But several factors working together, even if they are minor ones, can increase the odds in your favor.
Violations are negative factors, spam activities that can harm your visibility. Don’t do these! Violations, unlike the other elements, all begin with “V” regardless of what category they are in, so that they can more easily be identified as violations. Factors marked -3 are considered worse than -2 and -1.
Our Search Engine Land’s Guide to SEO has been updated to reflect all the changes to the table, and it goes into more depth about each factor.
What’s changed?
As with previous revisions, Search Engine Land’s editors considered new elements that should be included, pondered ones that should be dropped and reviewed those that deserved an increase or decrease in weight.
We also ran a survey asking readers to give their own opinions of how existing elements should be weighted, along with open comments about adding new elements. We received over 300 responses in all, and thanks to all those who helped!
For 2017, no new elements were added. Three elements had weight increases; two had weight decreases. Two elements were dropped entirely. The summary is below.
Factors with weight increases: Mobile, speed & direct answers
Am: Mobile — Google continues to push for content to be mobile-friendly, no surprise given that more than 50 percent of Google searches are done on mobile devices. In addition, by the end of this year or in 2018, Google will use a mobile-first index, even for desktop users.
All of this made us feel the mobile factor should increase to +3, a rise over the +2 it had in 2015 and the +1 when it was first added to the table in 2013. Those surveyed agreed, giving it a 2.8 average weight.
As: Speed — Google has continued to emphasize the importance of speed as a ranking factor, including widely implementing the AMP (Accelerated Mobile Pages) format that it backs. AMP didn’t even exist when our SEO table was last updated in 2015.
With so much attention on speed, it made sense to increase this factor’s weight from +1 to +2. Those surveyed gave it an average weight of 2.6, but we decided to be conservative with our increase.
Ca: Direct Answers — Both Google and Bing are increasingly showing direct answers that are culled from web pages above regular listings, something Google calls featured snippets.
Some publishers worry these are harmful, because if an actual answer is shown, why would people bother clicking to the source page? However, many others compete to be an answer, finding they do indeed drive traffic. Google’s featured snippets also serve as the single spoken answer that’s often given by the Google Assistant on mobile devices or in Google Home.
This factor was added in 2015 with a conservative +1 weight. Given the increasing prominence of direct answers, it made sense to raise the weight to +2. That also matches up with survey respondents, who gave it a 2.1 average weight.
Factors with weight decreases: Site and personal search history
Th: History — Google seems to have downplayed, in public statements or a lack of them, the importance of a site’s age or history versus years past. Given this, we felt dropping this factor from +2 to +1 made sense.
The factor was raised to +2 for the first time in 2015, when we agreed with the average survey response of 2.0. This year’s survey saw that drop to 1.8, giving us further reason to feel a decreased weight was in order.
Ph: History — Someone’s personal search history also felt to us like a factor that has decreased in importance. That’s why we’ve dropped it from +3 to +2. Survey respondents put it at 1.7, further reassuring us that the decrease was justified.
Factors that were dropped: Site identity and personal social sharing
Ti: Identity — We heavily debated dropping site identity as a factor when doing the 2015 edition, because Google had ended support for Google Authorship, which was the primary way identity seemed to be having an impact. However, those surveyed then gave it a 1.6 average score. Google also suggested that authorship was still being determined in other ways.
Since then, Google has backed away from authorship entirely. This year’s survey also saw it drop slightly to a 1.5 average. To us, there seemed little reason to continue listing this factor at all. We decided to drop it.
Ps: Social — Google+ was the primary way Google was using personal social sharing to influence someone’s search results. Google+ might continue in name, but its impact on Google’s search results seems all but gone — along with the users and brands that were active on the service. Because of this, we decided this factor deserved to be dropped. Survey respondents gave it an average weight of 1.6.
Factors considered but not added: App indexing and AMP
We wondered if we should add new elements for app indexing and AMP pages. People were asked to rate these on the survey. The average for app indexing was 1.7; for AMP, it was 1.8. We ultimately felt those were better considered as part of the existing mobile factor (Am) and decided not to add them as new elements.
Not changed but notable
As shown above, we don’t always go with what our survey suggests for a factor’s weight. Ultimately, we try to be a bit more cautious than what the survey suggests, plus we take into account things we’ve seen the search engines say or do.

Here are some notable diversions from the survey, where factors did not have their existing weights changed.
Au: URLs — The survey had keywords in URLs at 2.1, but we felt keeping it at +1 was fair.
Ah: HTTPS — The survey had the impact of running a secure site at 2.0, but we felt it was appropriate with its existing lower weight of +1. However, this could change in the future — and there are good reasons beyond SEO to make a site secure.
Ah: Titles — The survey gave keywords in title tags a 2.3 average weight. We kept it at +3, viewing it as an easy and still important area of focus.
Ah: Headers — The survey gave the use of header tags (H1, H2, etc) a 2.2 average weight. We felt that was too much and kept it at +1.
Ta: Authority — The survey gave the idea that a site or page has authority that helps with ranking a 2.4 weight. Google has certainly downplayed the idea of site or domain authority, as we covered recently. But it has given even further emphasis to the idea of page authority. We felt keeping this factor at +3 made sense.
Ln: Number of links — Those surveyed gave an average weight of 1.9 to the idea that sheer number of links is an important ranking factor. We remain conservative on this, keeping it at +1.
Pc: Country — Survey respondents gave a 2.1 average weight to the importance of someone’s country on the impact of the search results they receive. It’s easily demonstrated that country location has one of the most important influences on search results. Just ask anyone in a country different from the one you’re in to do the same search. They’ll usually have widely different results. We kept this at the highest +3 weight.
Pl: Locality — The survey gave a 2.3 average weight to the importance of someone’s city or locality on the impact of search results. As with country, we know — and anyone can easily test — that a city or regional location can have a huge impact. We kept this factor at +3 weight.
Ss: Social shares — The survey gave a 1.6 average weight to the idea that the sheer number of social shares can have an impact on search rankings. Social is generally an indirect benefit, in terms of Google. It has repeatedly said that it doesn’t try to measure social signals from Twitter or Facebook to rank results. But social sharing might lead people to link to and engage with sites, which are direct factors. Overall, we felt remaining conservative here with a +1 score made sense.
Vd: Piracy — The survey put the impact of having pirated or copyright-infringing content at -2.6. Sites with pirated content can indeed be hit hard by Google, but most sites don’t do this and so don’t need to worry about it. Hence, our lower weight of -1.
Va: Heavy ads — The survey put the impact of having sites heavy with ads or intrusive interstitials at -2.4. We agree that Google certainly seems to be looking harder (and penalizing) for this. Still, we decided to remain conservative and keep it at -1. However, there’s an excellent chance this could change in the future.
Vp: Paid links — The survey average for buying links was -2.1. We think that underestimates the negative impact on a site that’s caught doing this. We kept this at -3.
Factors not mentioned & the importance of quality
Above, we’ve only covered factors that had changes from the last edition or where we deviated from how survey respondents felt. There are many more factors than these, however — so please do review them all.
More than anything else, Cq: Content Quality, remains the bedrock of success. It’s the first factor on the chart and heavily weighted for a reason. If you have great content, all things good SEO-wise flow from that. Survey respondents agree, giving it a 2.8 average.
Source: Search Engine Land