Want to learn more about your website visitors?
Have you heard of Facebook Analytics?
In this article, you’ll discover how to install and use Facebook Analytics to reveal data about the Facebook users who visit your website.
#1: Create a Facebook Pixel for Your Website
If you haven’t already installed the Facebook pixel on your website for Facebook advertising, you need to do so to get Facebook Analytics for your website.
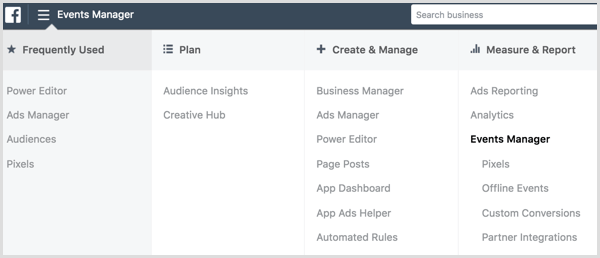
To install the pixel, go to your Ads Manager or Business Manager, click the advertising account for your website, and go to the Events Manager > Pixels dashboard.
Next, click the green Create a Pixel button.
![]()
On the following screen, click the Create button to create your first Facebook pixel.
![]()
Facebook gives you three options for installing the pixel code on your website: Use an Integration or Tag Manager, Manually Install the Code Yourself, or Email Instructions to a Developer.
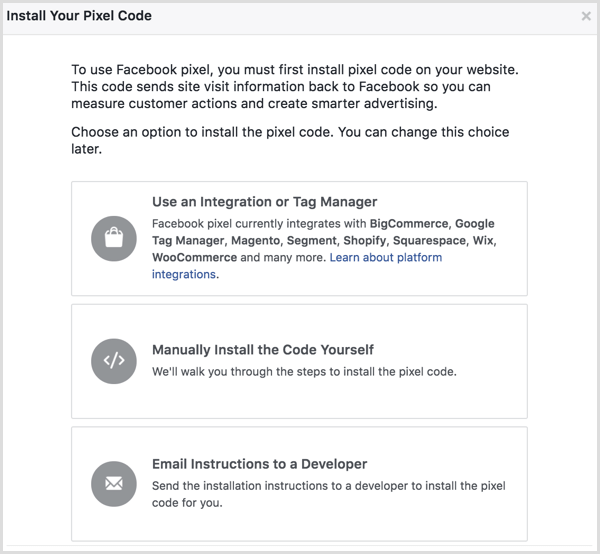
To get the most out of Facebook Analytics and your pixel, select the Manually Install the Code Yourself option. Facebook then gives you directions on how to install the main pixel code on your website.
After you install the code, Facebook can send test traffic to your website to confirm the pixel is installed correctly.
![]()
When you click Continue, you get additional options for tracking specific events on your website.
![]()
If you toggle a specific event, you get the code you need to add to the web page to track it.
![]()
You can use the Send Event Parameters toggle to add dollar values to applicable events such as generating leads or purchases.
![]()
After you set up the events you want to track with your pixel, click Done at the bottom of the screen to finish your setup. As visitors start coming to your website and the pages where you installed the pixel event code, you’ll see the data in your Facebook pixel dashboard.
![]()
The time it takes to collect data from your website with the pixel depends on the number of people who visit your website on a daily basis. Until you receive 100 visitors who are over 18 and have been active for 30 days, you’ll see this or the Not Enough Data message:
![]()
#2: Add Events Tracking to Your Existing Facebook Pixel
If you already have a Facebook pixel installed on your website, it will track the Page Views event by default. To get the most out of Facebook Analytics and your pixel, track additional events with the pixel.
To update an existing Facebook pixel, visit the Events Manager > Pixels dashboard in your Ads Manager and click the Set-Up button next to your pixel.
![]()
Next, choose the Manually Install the Code Yourself option.
Toggle the events you want to track on your website to get the code you need.
![]()
When you’re finished, click Done at the bottom of the screen to finish your setup. As people start to visit your website and the pages where you installed the pixel event code, you’ll see the data in your Facebook pixel dashboard.
![]()
#3: View Facebook Analytics Data for Your Website
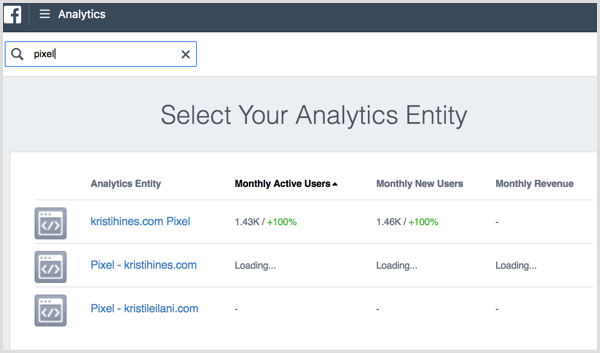
After you create a Facebook pixel, you can see it in the list of analytics entities for your Facebook Analytics. Use the search box at the top left of the screen to filter your entities by keyword and see a preview of users (visitors).
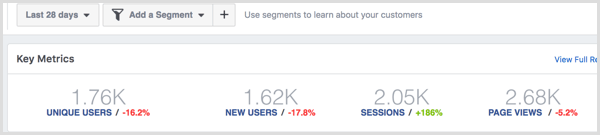
When you click the pixel that corresponds to your website, you see the Facebook Analytics Overview screen. Here, you’ll find a summary of the Facebook Analytics data for your website, starting with the number of unique users (number of unique website visitors), new users (number of new website visitors), sessions (number of website visits), and page views (number of pages viewed in a session) in your key metrics.
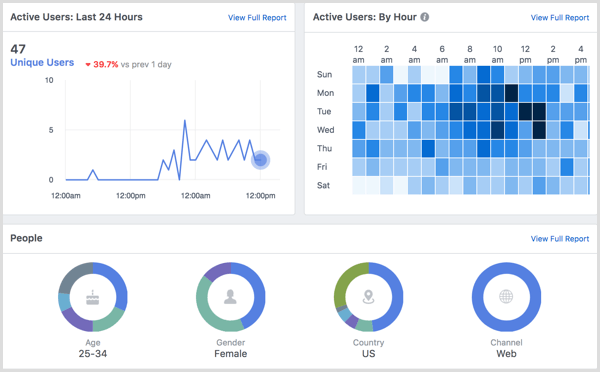
Next, find out when people visit your website most in the Active Users: Last 24 Hours and Active Users: By Hour blocks. You also get some basic demographics for your website visitors in the People block.
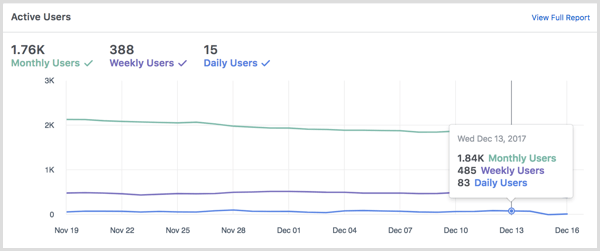
In the Active Users block, you can see the number of visitors by month, week, and day.
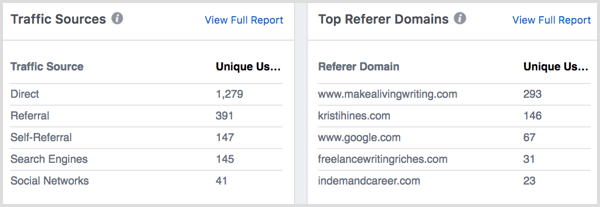
Beneath that, view the top traffic sources, referrer domains, and top URLs (pages on your website with the unique visitors).
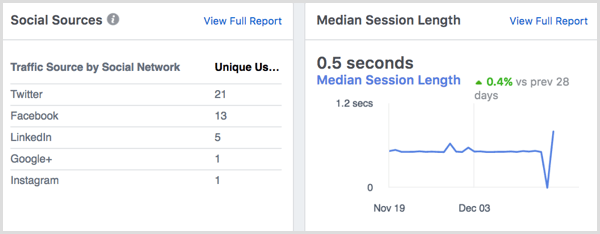
Next, view search sources, social sources, and median session length (average time visitors spent on your website).
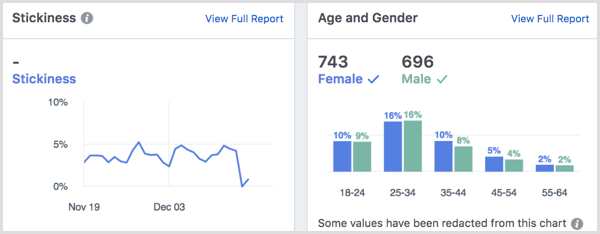
Finally, get stickiness (monthly active users divided by daily active users), age and gender, country, and device OS data.

Click the View Full Report link at the top right of any block in the Overview screen to see detailed breakdowns of the data presented.
#4: Create Customized Views of Your Facebook Analytics Data With Segments
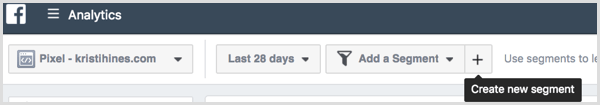
Facebook Analytics offers several ways to customize how you view Facebook Analytics data for your website: Segments, Funnels, Cohorts, and Breakdowns. You can access and create segments at the top of your analytics data.
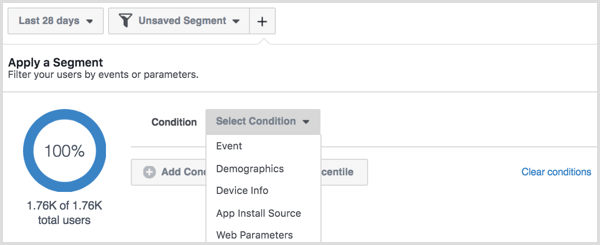
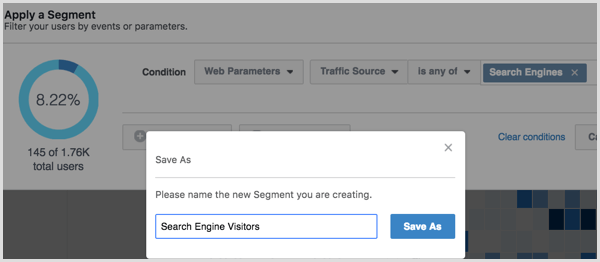
When you set up a new segment, you create a view that filters your Facebook Analytics data based on conditions you define.
Segments can be defined by events tracked with your Facebook pixel, demographics (age, city, country, gender, and region), device info (details about technology used by your visitors), and web parameters (domain, URL, referrer, traffic source, or UTM).
As you define your segment, you see a preview of the total number of users within that segment.
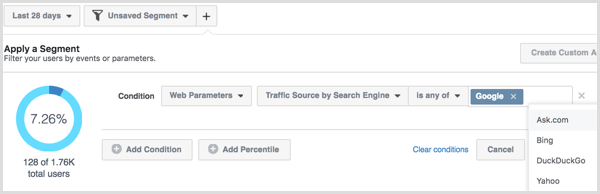
After you’ve defined your segment, click the Save button at the bottom and name it.
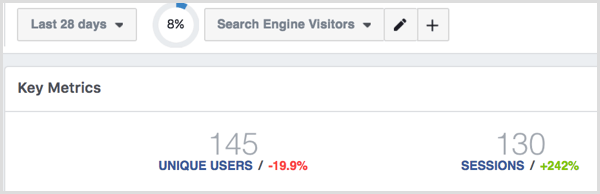
To use your segments to view the Facebook Analytics for your website based on the conditions you defined, apply your new segment or select the segment from the drop-down menu at the top of the screen.
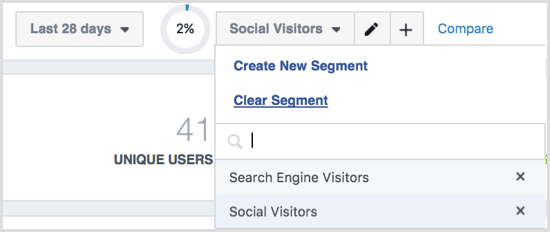
From the Segments drop-down menu, select Clear Segment to remove the filter on your Facebook Analytics data, choose a different segment to view, or click the X to delete a segment you created.
#5: Track Visitor Behavior Throughout Your Sales Funnel
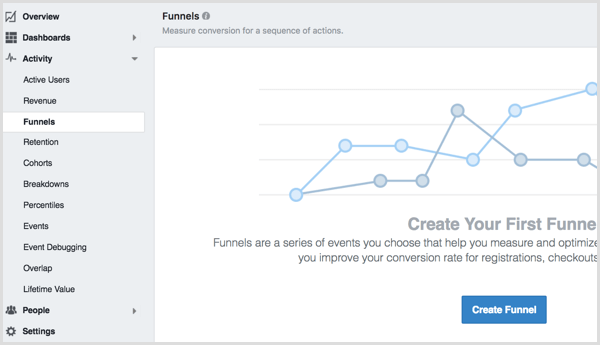
If you create events for your pixel that track specific steps visitors take to make a purchase on your website, you can use those events to create a funnel. For example, if your website has an e-commerce checkout system, track when visitors add a product to their cart, initiate checkout, add payment information, and complete their purchase using events with the Facebook pixel.
To create a funnel, click Funnels in the left sidebar menu of Facebook Analytics and then click the Create Funnel button.
Use the drop-down menu to find the events that correspond to each step of your funnel.
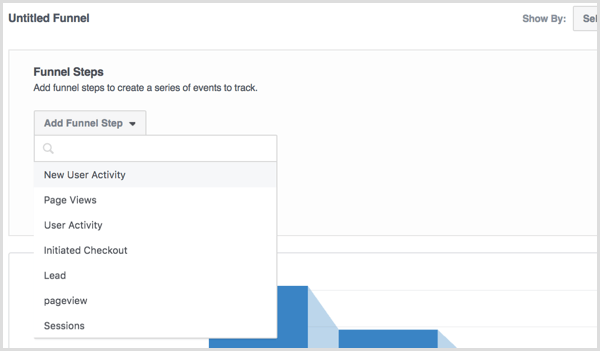
When you’re finished adding steps to your funnel, click the Apply button to see how your funnel data will look.
Click the Save button to save funnels for future reference. Use this data to see where visitors exit your sales funnel or lead generation process. If you notice a lot of visitors drop off at a certain step in your funnel, visit that step on your website to see if you can optimize it to convert more visitors.
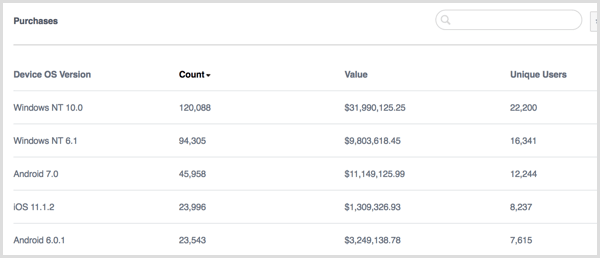
#6: View Data for Purchases
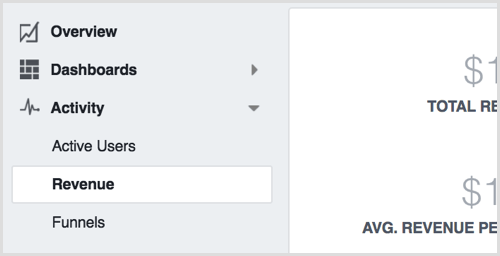
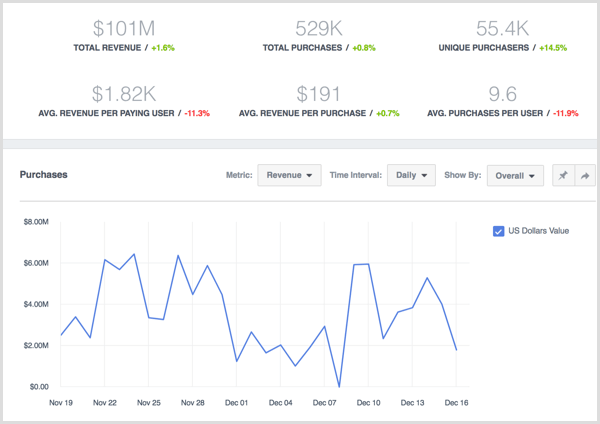
If you added dollar values to the events tracked by your Facebook pixel, you can see demographics and additional data about your customers. Click Revenue in the left sidebar menu.
Use this data to view revenue amounts and purchasing trends over a specific time range, including a demographics report showing the age and gender breakdowns of your customers.
#7: Learn How Groups of Visitors Behave Over Time
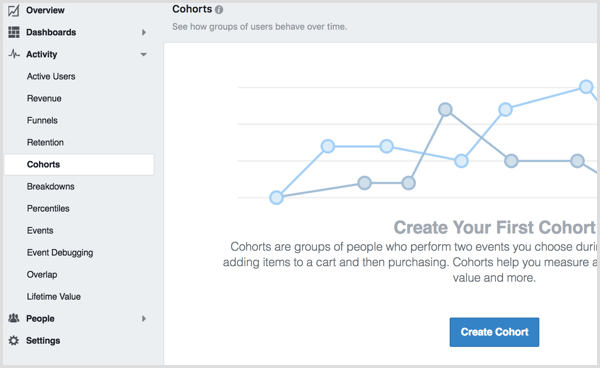
Cohorts reports let you view people who complete two events tracked by your Facebook pixel, such as a new user visiting your website and submitting a lead form.
To create a cohort, click Cohorts in the left sidebar menu and then click the Create Cohort button.
Select the two events you want to analyze.
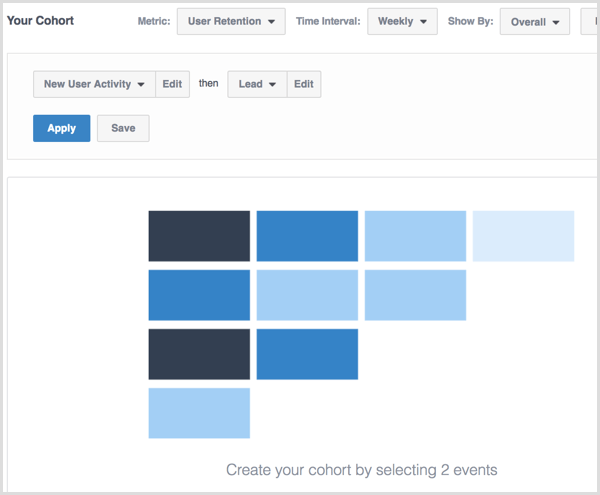
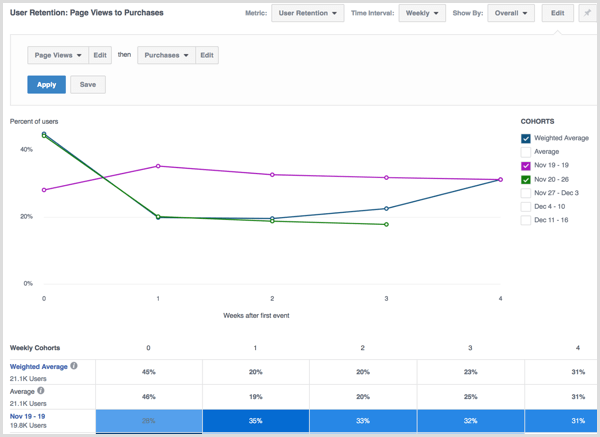
When you click the Apply button, you’ll see the data that will help you measure and optimize for retention, lifetime value, and more.
Click the Save button to save cohorts for future reference.
#8: Create Your Own Custom Breakdowns
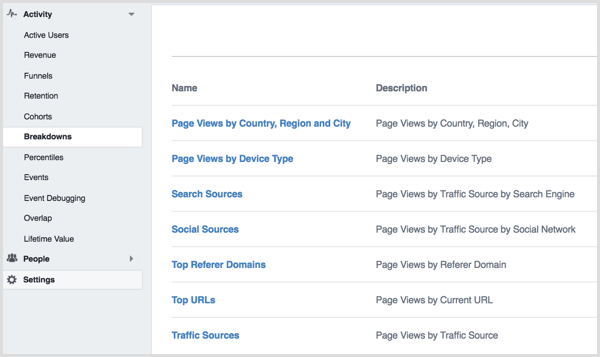
Breakdowns allow you to view event parameters for the events tracked by your website’s Facebook pixel. When you click Breakdowns in the left sidebar menu, you’ll see some default breakdowns created by Facebook. Use these as examples for your own breakdowns.
To create your own breakdown, click the Create Breakdown button at the top right of your screen. On the following screen, choose your event and the three parameters you want to use to analyze it.
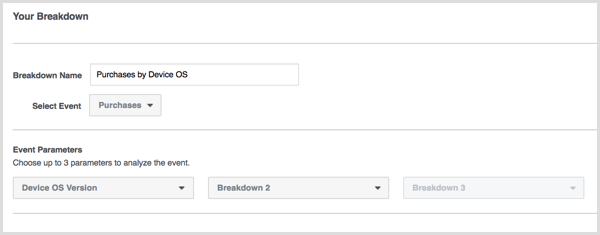
Click Apply to see your results.
Use the drop-down menu next to the Apply button to save breakdowns for future reference.
#9: Discover the Most Active Users of Your Website
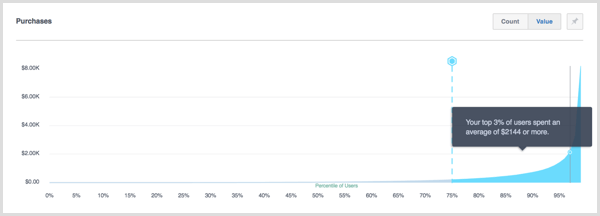
The Percentiles report allows you to see which groups of visitors to your website are the most active or producing the most value through purchases. When you click Percentiles in the left sidebar, you should see percentiles for Page Views by default.
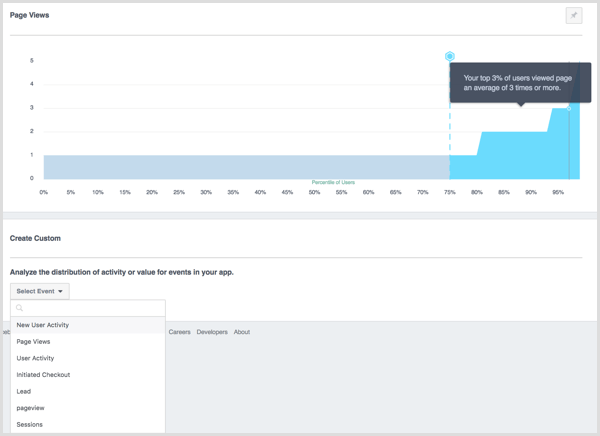
According to Facebook, the above report shows the distribution of people who have viewed a page on your website, where X is the percentile of users and Y is the number of page views. You’ll see the average number of times your top 30% of users have viewed a page on your website if you’re viewing the 70th percentile for page views.
Below the default, you can select from the list of events tracked with your Facebook pixel to create a custom Percentiles report for purchases, leads, and other visitor activity.
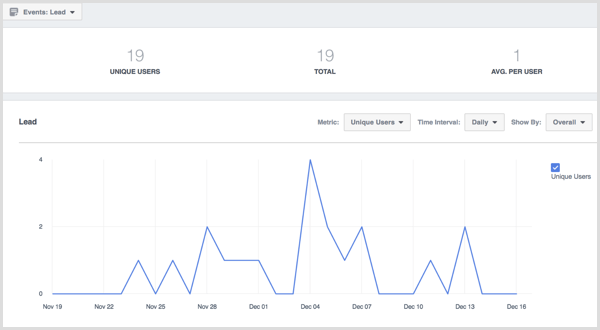
#10: View Analytics for Your Events
Click Events in the left sidebar to see all of the events your Facebook pixel tracks.
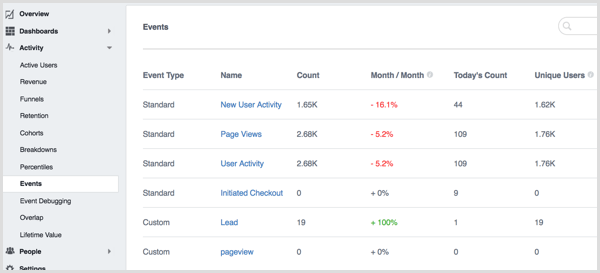
When you click through to an event, you see an overview of Facebook Analytics for visitors who completed that event.
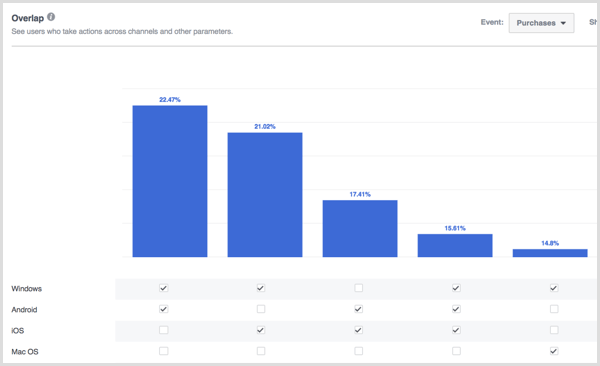
#11: Review Overlapping Audiences
With Overlap, you can review how many unique users engage with your website on more than one channel or parameter. For example, your customers may use multiple devices when making a purchase from your website. Using the drop-down menus to select an event and event parameter, you can see how customers use multiple devices and which devices they use.
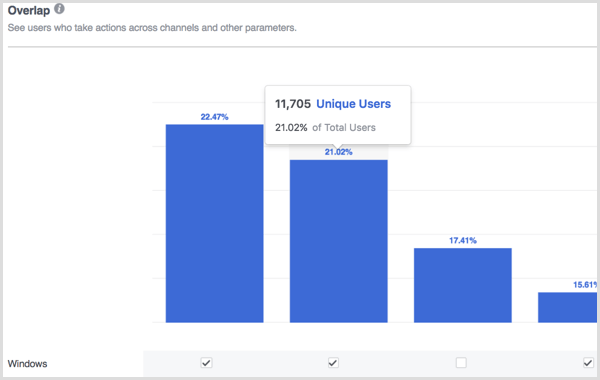
Hover over the bars to get specifics.
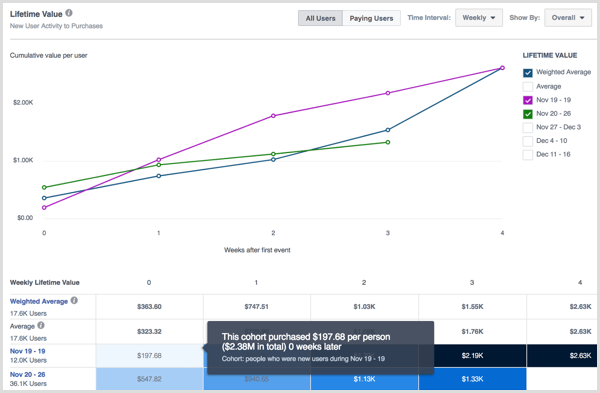
#12: Visualize Lifetime Value
If you’re tracking purchases with your Facebook pixel, you can click Lifetime Value in the left sidebar to see the lifetime value of your visitors. Hover over the blocks of data for more information.
#13: Dive Deep Into Your Visitor Demographics
Under the People section in the left sidebar, you’ll find five reports for your website visitor demographics, starting with Highlights.
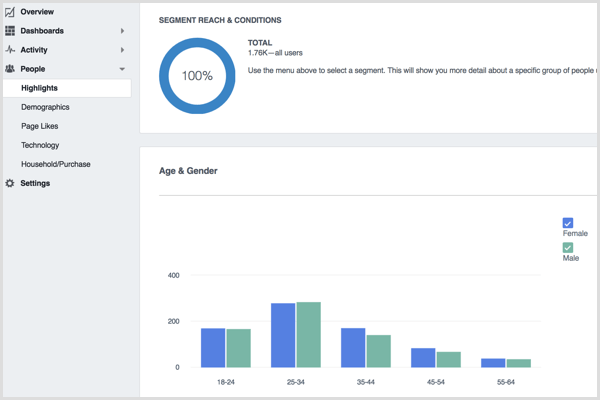
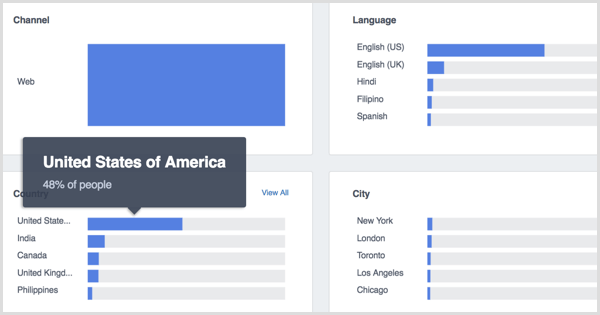
In the Highlights report, you’ll see an overview of the breakdowns of age and gender, language, country, and city of your visitors.
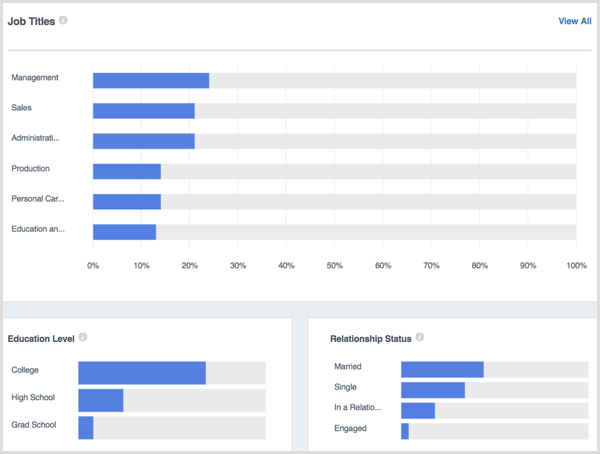
In the Demographics report, find job title, education, and relationship status dataabout your visitors.
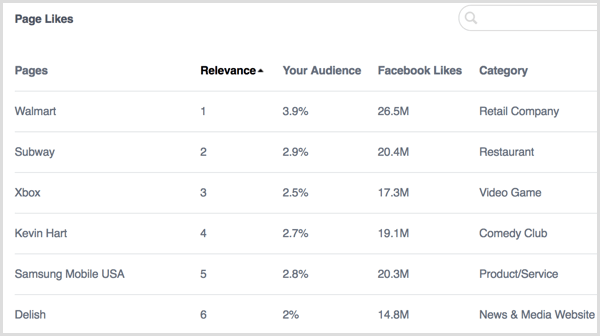
In the Page Likes report, view the pages most liked by people who have visited your website.
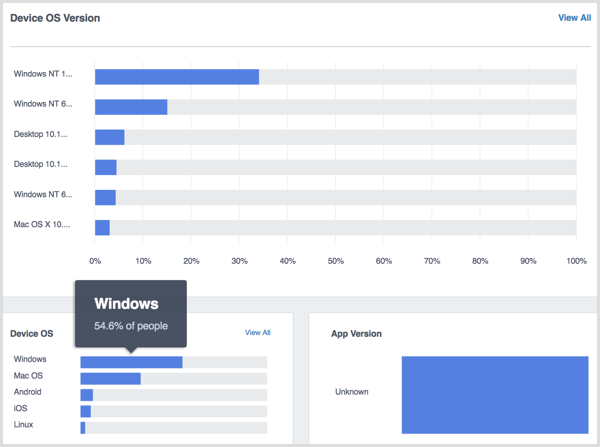
In the Technology report, discover the device OS version, device OS, app version, and device model used by each of your visitors.
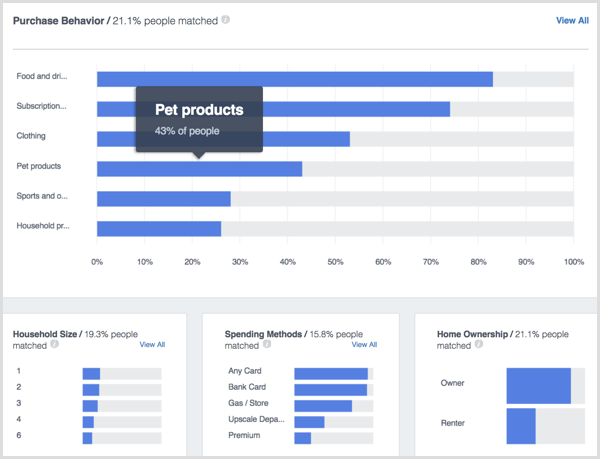
Click the Household/Purchase report to see additional information such as household income, retail spending, purchase behavior, household size, spending methods, home ownership, and lifestyles of your website visitors.
#14: Check Your Settings
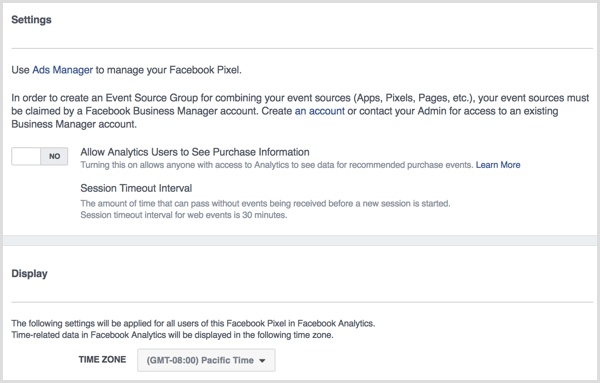
The last item in the left sidebar, Settings, lets you view the settings for your Facebook Analytics entity. This is where you can choose to allow all analytics users the ability to see purchase data, update your time zone, and adjust any other settings related to the Facebook Analytics for your website.
You can find the settings for your Facebook pixel under your Ads Manager.
Conclusion
As you can see, Facebook Analytics offers a lot of valuable information for business owners and marketers. You can use this data to see what Facebook captures about your website visitors.
source: Social Media Examiner