Mobile marketing – the measures you take to showcase your business to users of mobile devices – has been around for quite some time. Ideally, you should have some sort of mobile marketing strategy in place already to tap into this critical consumer segment.
This could range from something as basic as ensuring that your content is adaptable to different screen sizes to more advanced offerings like useful location-sensitive information for shoppers on the move.
In order to help you with the most comprehensive set of insights you will need to shape your strategies, we have put together the most relevant mobile marketing statistics for 2019. Smart marketers might be familiar with some of these data points, like the one about the incredibly high share of mobile advertising in overall digital ad spend.
But many others, like the point about time spent by mobile users on apps as compared to mobile websites, are equally important bits of information that you may not have paid heed to till now.
As always, for your easy reading, we have divided these statistics into clear categories. First, we begin with some useful statistics that showcase the widespread use of mobile devices to access the internet. Then we share some facts to give you a clear idea of how mobile access affects consumer behavior. Finally, the most important marketing statistics of the mobile era help you realign your marketing strategy with the reality in 2019.
Top 10 Mobile Statistics (Editor’s Choice)
- 80% of internet users own a smartphone.
- Mobile devices are used for over 40% of online transactions.
- 52% of companies use a simple template that works for all devices.
- Apps account for 89% of mobile media time.
- 80% of shoppers use smartphones during physical shopping.
- 91% of users say that content is very important.
- 60% of users want fast loading websites.
- A delay of one second in page response can reduce the conversions by 7%.
- 39% of companies create a mobile responsive email template.
- Google owns 96% of mobile search traffic.

General Mobile Marketing Stats
1. Mobile data traffic around the world is projected to increase by 700% between 2016 and 2021.
It’s even more impressive, considering the volume of mobile data traffic in 2016 is nothing to sneeze at. According to Cisco’s Global Mobile Data Traffic Forecast, this striking growth will be spread uniformly across the world. As expected, a little over half of this will be driven by video content.
2. 80% of the internet users own a smartphone.
Since cell phone services continue to give away free smartphones with their contracts, this figure will only increase in the next few years. That’s a great piece of news for companies that employ a mobile marketing strategy.
3. There are over 4B unique mobile internet users in the world.
What percentage of internet traffic is mobile? Sometime between 2014 and 2015, the mobile internet penetration figure crossed the 50% mark. Today, more than 61% people worldwide have access to mobile internet, and the figure is consistently rising. It is difficult to overstate the reach this gives to any business with a smart mobile marketing strategy.
4. US adults spend an average of 3 hours, 23 minutes per day on mobile devices in 2018.
This figure was at 1 hour, 22 minutes just 6 years ago. Also, according to mobile marketing statistics in 2018, turns out people don’t watch cat videos on social media as much as we think they do. Anyway – it is clear marketers now have more time available to capture the attention of consumers. They still need a coherent strategy to beat the competition presented not just by other businesses but also by any other interesting pieces of content.
5. More than 60% of B2B buyers report that mobile played a significant role in a recent purchase.
If the trend towards mobile transactions is encouraging for general consumers, it is even more eye-catching in the case of B2B commerce. Mobile content has influenced over 60% of B2B buyers either directly or indirectly in making a purchase in recent times.
6. 70% of B2B buyers increased mobile usage over the past years; 60% expect their mobile usage to increase.
Driven by careful planning and investment on the part of sales and marketing teams, B2B ecommerce is moving online. The time to purchase has fallen significantly, particularly in more complex transactions. The positive mobile user experience improves repurchase rates as well. Therefore a business must strive to engage potential customers on their smartphones, or they risk losing sales and market share.
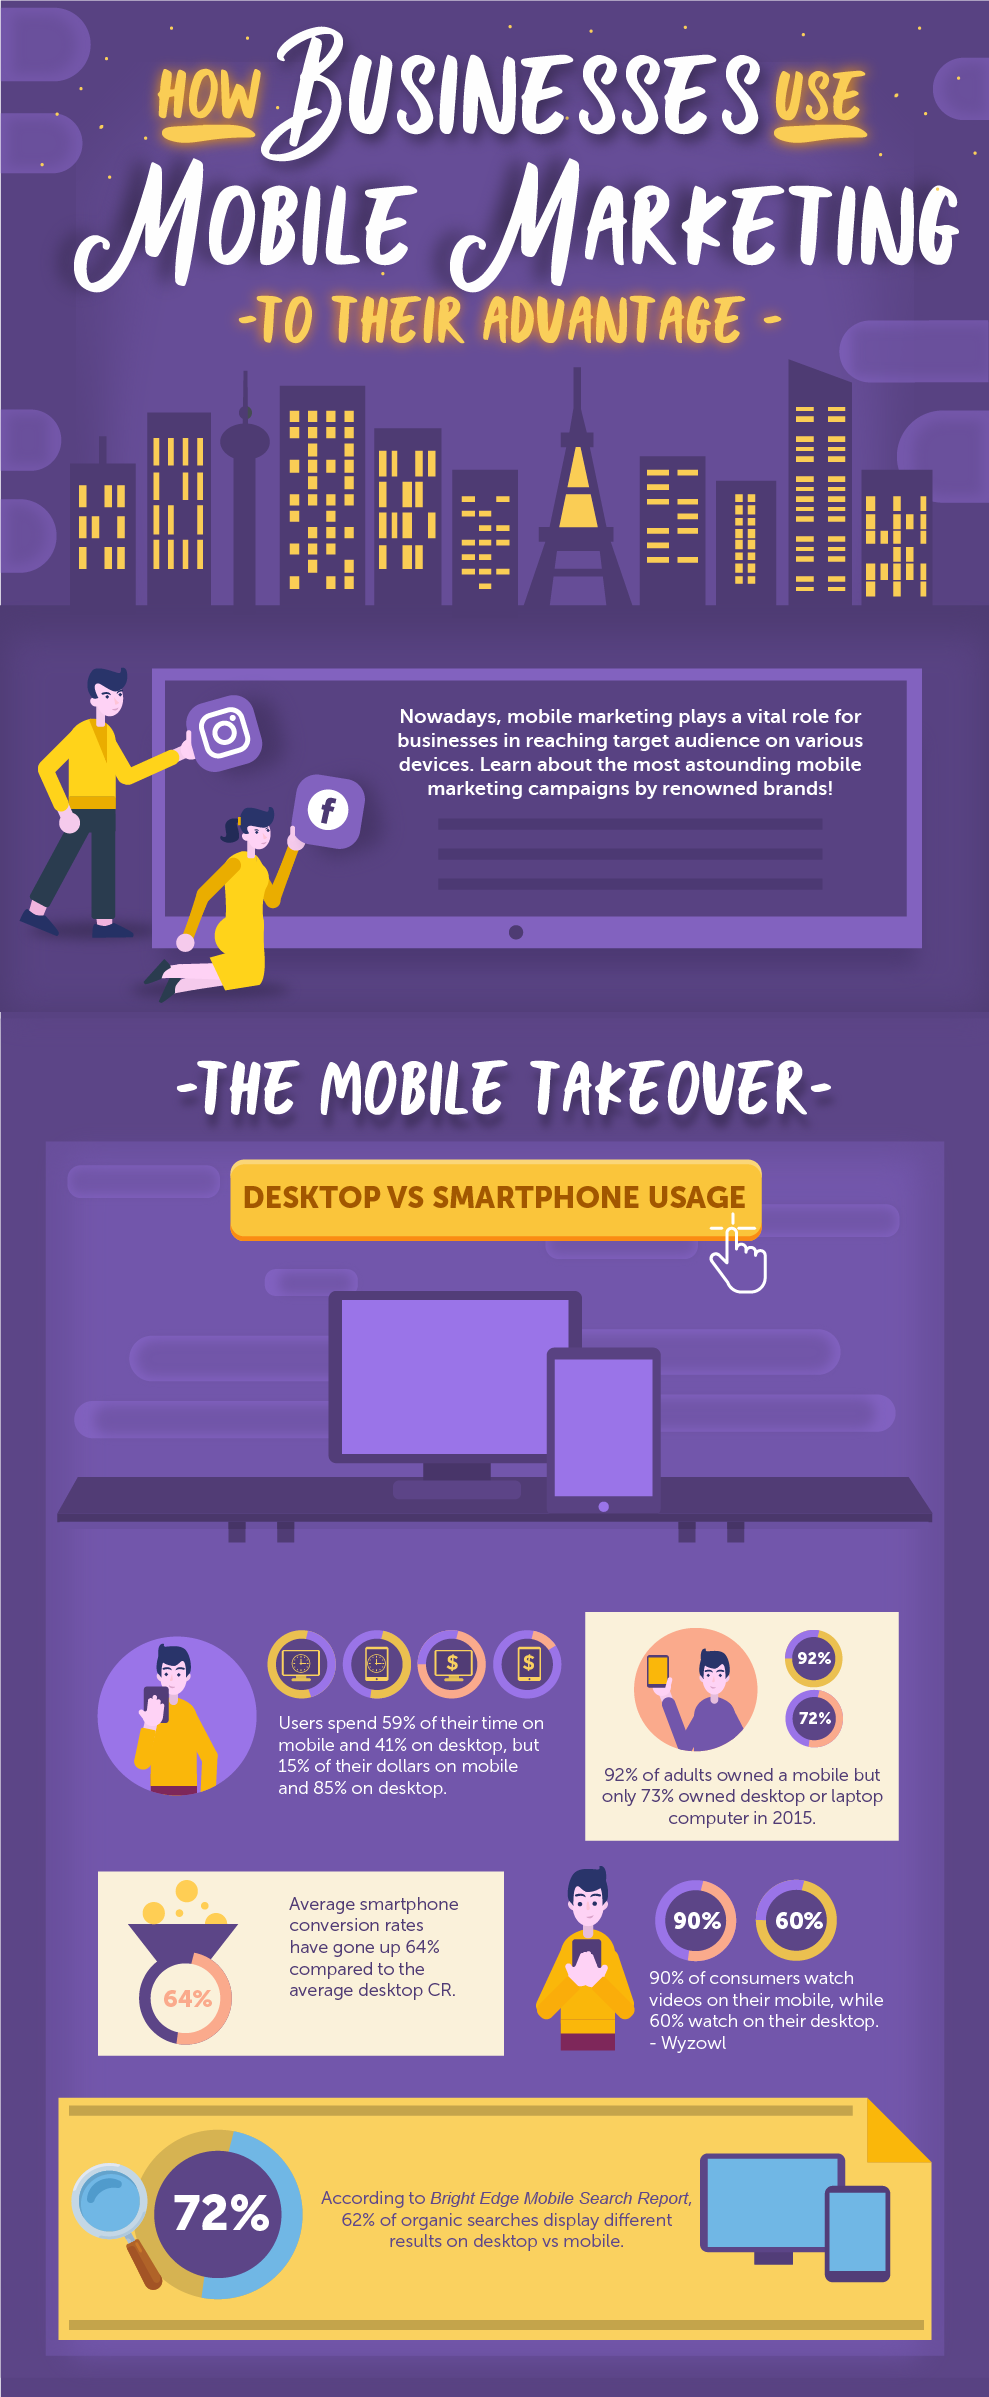
Mobile vs Desktop Internet Usage Statistics
7. Email recipients prefer to open emails on mobile devices.
Email – that most basic of communication forms today – is already being accessed on mobile devices more often than on desktop. The exact figures vary, depending on the survey sample, but this much is clear – the mobile vs. desktop contest has been leaning in favor of the former for some time now.
8. Over 80% of Alexa websites are mobile adaptive.
Is it any surprise that most sites with global popularity have turned mobile adaptive in the last few years? Companies – whether they are ecommerce sites, social media networks, discussion forums or content aggregators – know from their mobile browsing stats that a large number of their visitors come to them through mobile devices.
9. Mobile devices are used for over 40% of online transactions.
The widespread use of mobile devices is not limited to essential functions, of course. With feature-rich mobile devices available at affordable prices and users’ increasing comfort in spending online, online transactions on mobile are becoming increasingly common. Consumers are spending more on the go instead of waiting to reach their computer to make a purchase.
10. After seeing a relevant ad, 91% of smartphone owners make or plan to make a purchase.
Smartphone ads also have a higher conversion rate than online ads experienced on desktops, and definitely much higher when compared to traditional advertising media. What is needed is an ad that gets its message and target audience right, as well as a smooth sale process.
11. 95.1% of active Facebook user accounts accessed the social network via a smartphone.
That’s as good as any a data point to show the power of mobile devices. Almost all active users of the most popular social media network in the world access it either only using their smartphones or alternate between their phones and computers.
Mobile Usage Statistics
12. By 2020, VR & AR will become independent industries.
Virtual reality and augmented reality ads deliver immersive brand stories to consumers. This leaves an imprint, which can convert a one-time customer to a long-term one. Technology has evolved to make the deployment of such ads cheaper and accessible to businesses of all sizes.
13. Shocking mobile statistics: 80% of B2B buyers are using mobile at work.
The increasing use of mobile devices is reflected at the workplace as well. For B2B buyers, the digital experience plays a particularly important role in the early stages of formulating purchase intent.
14. A positive brand experience on mobile will make 89% of people more likely to recommend a brand.
Investing smartly in providing a positive brand experience to consumers is extremely important. When there is so much information vying for a mobile user’s intention, your message needs to stand out. Equally importantly, a positive experience ensures not just a strong relationship with one consumer. It can also result in an exponential effect through recommendations to other consumers.
15. 46% of people would not purchase from a brand again if they had an interruptive mobile experience.
Mobile marketing stats show that consumers are becoming increasingly less forgiving, demanding a memorable encounter every time they visit you. They have many options to choose from, so they’ll move on if your proposition is not attractive enough.
16. A negative brand experience on mobile, on the other hand, makes people 60% less likely to purchase from that brand ever again.
As a corollary to the last two points, research has clearly shown that a negative experience can cause long-term harm to your brand and erode the customer base if not corrected urgently. Interestingly, this negative experience reflects badly not just on the online presence of the business, but on the entire brand.
17. If the mobile page takes longer than 3 seconds to load, 53% of people will leave it.
Many business owners and marketers do not consider this factor often enough. You might pack your page with striking mobile videos, but if it takes too long to load, it will have the opposite effect. In fact, neuroscience researchers have discovered that today’s consumers find long mobile loading times more stressful than viewing a horror film!
18. A “neutral” experience is a negative experience.
Providing an “adequate” experience to your consumers doesn’t cut it anymore. If a company does not offer a consistently delightful and relevant mobile experience, it strongly hurts the perception of the brand.
19. 77% of American ad block users are willing to view some ad formats.
Google’s introduction of a built-in ad blocker for Chrome raised concerns about a fall in online advertising. This feature made particular sense for touch screen mobile devices, where closing out ads is more difficult than on a laptop. To some advertisers’ surprise, turns out users do have an issue with all ads, only the obnoxious and irrelevant ones.
Mobile Device Usage Statistics
20. 83% of mobile users say that a seamless experience across all devices is very important.
Mobile users do not exist in isolation, and often access the same content through different channels. One way to ensure they remain engaged is to provide them equally good experiences no matter what device they reach you from.
21. 52% of companies use a simple template that works for all devices.
To design a mobile friendly website, marketers need to understand the issues faced by their customers. One basic step to ensure mobile friendliness is to have a website design that works across all devices. This saves you a lot of trouble later on and keeps your customers happy too.
22. Compared to other social platforms, LinkedIn is 277% more effective for lead generation.
An example of a site that has integrated mobile well into its marketing strategy is LinkedIn. It is a lead generation gold mine, especially for B2B commerce.
23. Mobile devices are responsible for 60% of LinkedIn traffic.
And, of course, show that more than half of the traffic on the site is already channeled through mobile devices. LinkedIn moved to become a mobile-first company in 2016, and it was a sign of things to come. Your own business might not get all or even most of its traffic from mobile devices today, but being prepared for the possible shift to mobile browsing is absolutely necessary.
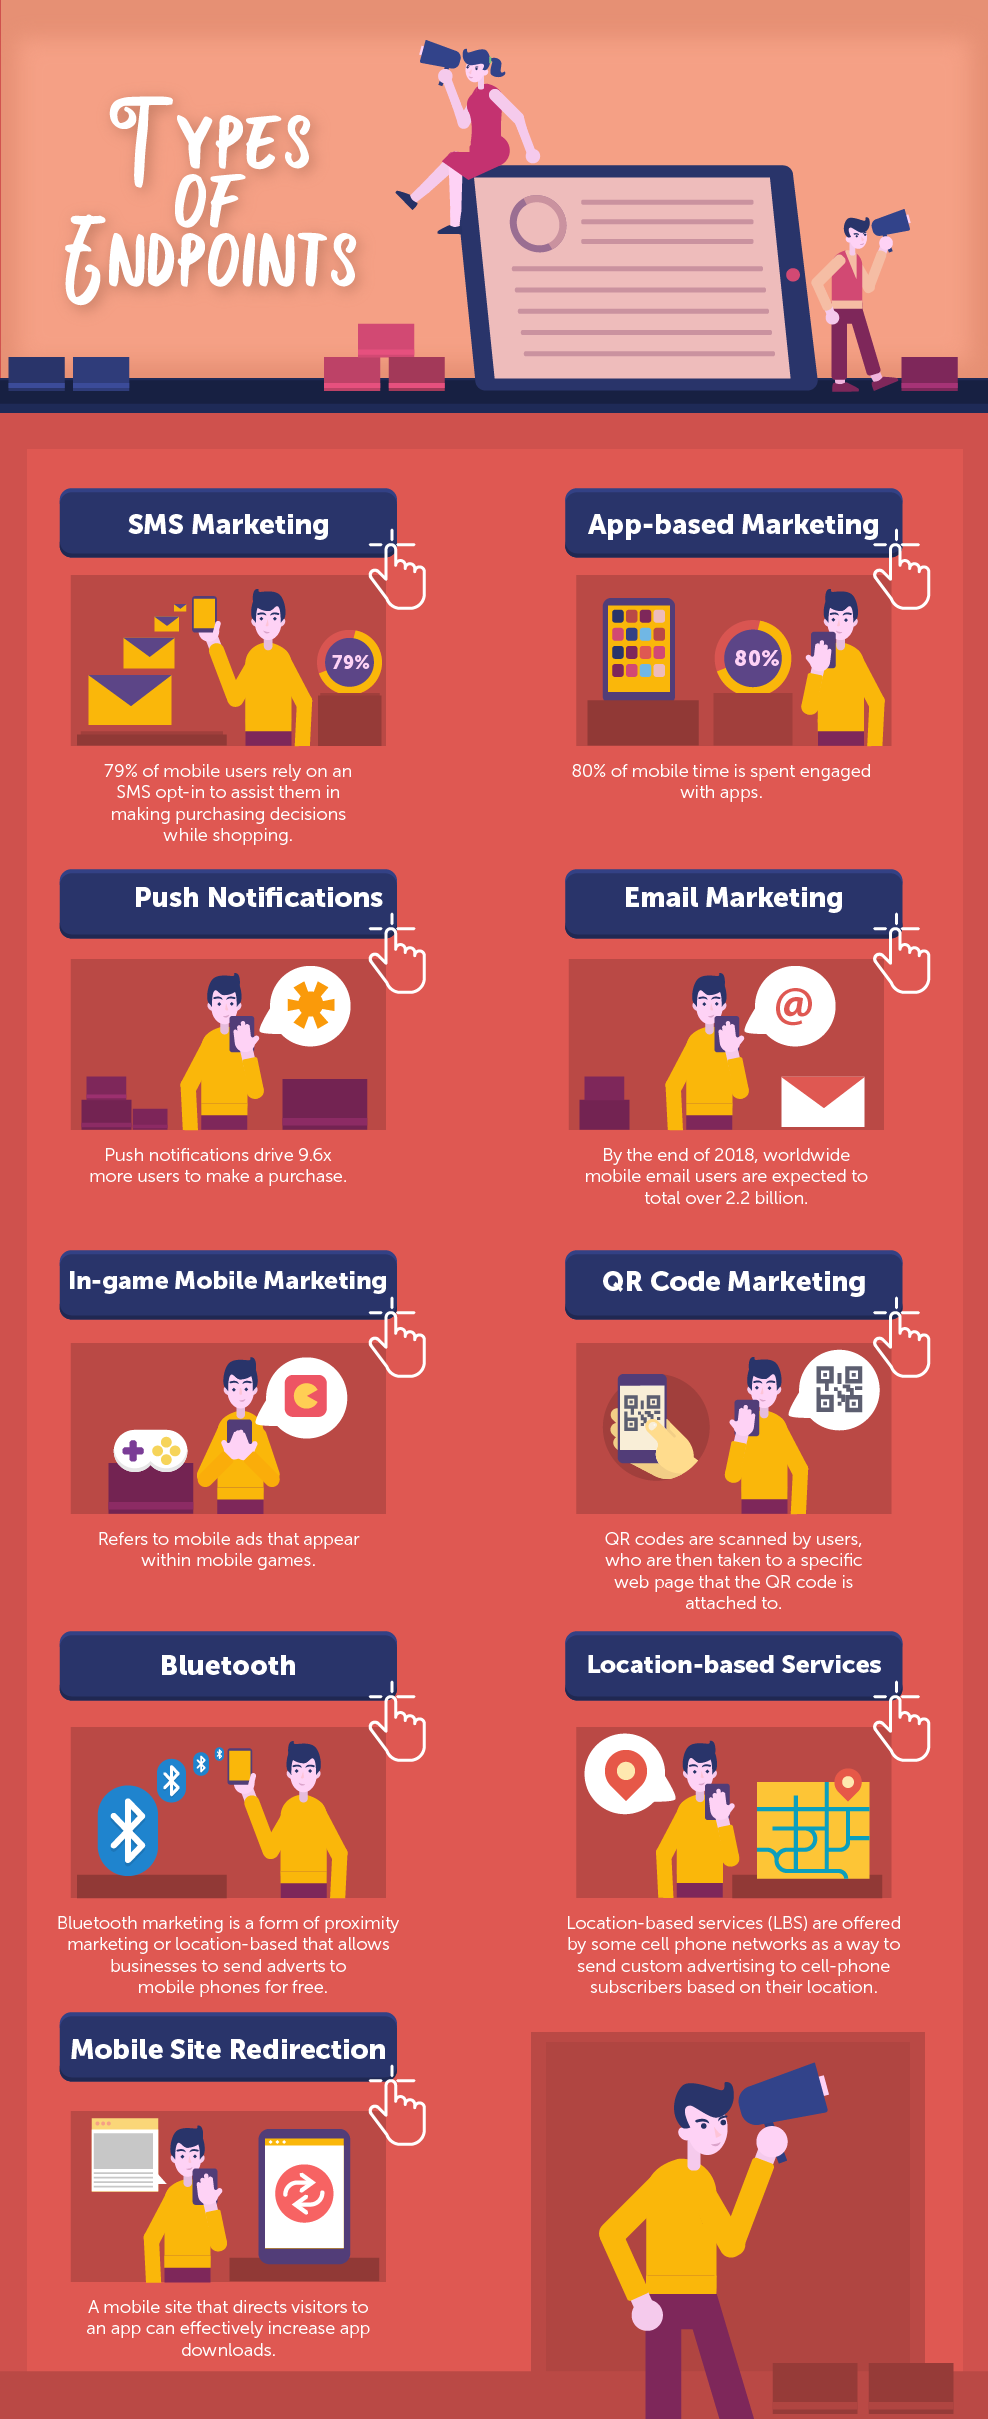
24. Apps account for 89% of mobile media time.
Several factors are responsible for this heavy bias in mobile device usage. Things like a higher quality of content, more organized presentation and accessibility across social networks work in favor of mobile apps vis-à-vis mobile websites. It is natural to expect, then, that the bigger chunk of ad spending will also go towards mobile apps.
25. Almost half of the small businesses own a mobile app.
Mobile apps improve brand image and boost customer loyalty. But any business needs to truly understand the inputs needed to build and maintain a successful app. This is particularly true for small businesses that tend to have limited resources.
26. For 83% of B2B marketers mobile apps are important in regards to content marketing.
B2B commerce is also moving at a healthy pace on to mobile devices. The basic strategies are no different from what marketers use in B2C commerce, and in fact many new technologies are being used in this context first to reshape the purchase pathway.
Smartphone statistics 2019
27. The average smartphone user checks their smartphone 150 times a day.
This behavior is familiar to many of us. This includes times when we are not actually using an app or function on the phone, but we keep checking for messages, mails or social media account updates.
28. 80% of shoppers use smartphones during physical shopping.
In the US, shoppers often use a smartphone inside a physical store to look up product reviews, compare prices or find alternative store locations. Smart business owners, then, have new ways to increase conversion rates.
29. 70% of smartphone users have bought something in a store after using their phone to discover more information.
Mobile marketing statistics show that even those shoppers who actually purchase a product in a physical store are guided to that decision by smartphones. Any discerning shopper wants to make good use of the immense quantity of information available through their phone and make a wise decision.
30. 69% of smartphone users would buy from stores that have mobile sites which cover their questions or concerns.
Understandably, an equal number of consumers would trust a company with their money if their queries are satisfied. All of this information reinforces the need for a business to have a relevant mobile presence.
31. 50% smartphone users are more likely to expect to purchase something immediately while using their smartphone.
Smartphones statistics show that mobile shopping makes it easier for users to purchase what they want. Also because one can move quickly across different apps on a smartphone, a user who gets on her phone to read the latest news on one app can end the session with a purchase on another app. That can happen even though they had no intention of buying anything when picking up their phone.
32. 2/3 of smartphone users are more likely to purchase from companies whose apps customize information to their location.
We meet our old friend – localization – again. Customizing information according to the user’s location makes it much more relevant. Relevance drives a purchase.
33. 74% of smartphone users look for the most relevant information without considering which company provides the information.
Relevance beats brand loyalty. This is a particularly attractive bit of statistic for small, localized businesses. If you can reach the user with relevant information, you can steal them from your larger competitors easily.
Mobile Advertising Statistics 2019
34. 57% of users say they won’t recommend a business with a poorly-designed mobile site.
This is a cautionary statistic for those businesses that still believe mobile marketing is not for them. Your mobile presence is very often the first port of call for a potential customer, and if this experience is not memorable, you don’t just lose that particular customer but many others who would have heard of you through them.
35. 91% of users say that content is very important.
To successfully turn a prospective visitor into a paying customer requires marketers to understand what consumers’ preferences are. Mobile marketing statisticshave shown time and time again that content is king. If your message isn’t right, your ad spending will bring poor results.
36. 60% of users want fast loading websites.
While you are focused on content, keep in mind the importance of the overall experience. A well-designed website that takes ages to load can’t get you the results you desire.
37. Access problems are reason number one for 40% of users to visit a competitor’s website.
It’s not just speed, of course, that can make access difficult. Mobile search statistics show that common problems encountered by users can include frequent crashing or freezing of a webpage, formatting that makes it difficult to read, links leading to wrong pages or simply a website experiencing downtime.
38. 90% of buyers who had an excellent mobile experience would buy from the same vendor again.
If you can tackle these common issues, nearly all of your customers are likely to come back to your mobile site. This, obviously, would mean that you can show them more products, lead them to affiliates, get them to recommend you to their friends, and so much more.
39. A delay of one second in page response can reduce the conversions by 7%.
Accessibility issues have a direct bearing on your bottom line. If we look at the above data point in the context of an ecommerce site that makes $100,000 per day, a 1 second page delay could cost the site $2.5 million in lost sales every year!
40. 61% of users would choose to buy from a site that has location customized marketing material.
Taking advantage of the built-in GPS capabilities in most phones today is a very smart way to anticipate your customers’ needs. Presenting a customer with personalized options, again, requires little actual effort from your side, but can go a long way in impressing him.
41. Organizations are experiencing as high as 3x ROI for personalization efforts.
Personalization is not just a “feel good” factor. Mobile marketing stats prove that such efforts have objective, measurable benefits. They can earn you as much as three times what you invest in setting up your mobile marketing systems.
42. 39% of companies create a mobile responsive email template.
Given the importance of email in the overall context of mobile marketing, it is no surprise that companies are gradually realizing the value of using email templates that work on smaller screens also. This is the least you can do to ensure that your campaign doesn’t fizzle out before it even starts working.
Mobile Search Statistics 2019
43. 48% of buyers start product search from their phones.
Mobile is increasingly the dominant platform for information gathering and product discovery. Moreover, a consumer looking up one product of a certain type, is likely to come back for related products as well.
44. 51% of customers say that they use mobile devices to discover new brands and products.
This is just one of many statistics that show that an improved customer experience pays dividends by delivering better business performance. While this study on customer loyalty has surveyed, 5000 European consumers, the idea that mobile users are actively looking for new brands and products through their online experience holds true for people everywhere.
45. Smartphone ads get more than 50% of people to begin a product search.
According to Google data, after seeing an ad on their smartphone, more than half of people follow it up with a mobile search to collect more information or visit the linked website. The same article also confirms that more searches originate on mobile than on desktop.
46. Google owns 96% of mobile search traffic.
Everyone knows Google dominates mobile search as it does internet search in general. Still, a 96% share is nothing short of incredible. This is followed by Yahoo at 2% and Bing at 1%.
47. 70% of mobile searches result with an online action within an hour.
Mobile marketing statistics for 2019 show that it is not an idle pastime either, but a reflection of immediate purchase intent. If you are able to impress the user with relevant, smartly packaged information, you can be assured of a sale 7 out of 10 times.
48. Watch time of “does it work” videos grew by more than 11X as consumers seek out visual proof that the items they’re considering are worth it.
Monitoring search behavior can give marketers valuable insights into the minds of their consumers, who are becoming more cautious about researching products and services before spending their money. Use of keywords like “best”, “worst” and “to avoid” is reported to be on the rise by Google.
49. Mobile ad spending in the US will grow by 20% in 2018.
The total mobile ad spending for 2018 ($70 billion) appears even more striking when contrasted with the figure from just a decade back. It has clocked an incredible 21,775% growth since 2008 and is driving innovations on platforms like Google and Facebook as well as in countless products in the Android and iOS ecosystem.
50. Digital marketing software is projected to total more than $32B in 2018.
According to mobile marketing statistics research, the resultant effect on related businesses is equally remarkable. The digital marketing software industry, which is essentially responsible for getting mobile users to see your ads, is growing at a breakneck pace as well.
51. Android holds 68% of the global mobile advertising market.
Android’s share of mobile ad spending is particularly high in emerging markets, exceeding 90% in India, Indonesia, Peru and Argentina. iOS, though, leads the race in terms of effective cost per thousand impressions (eCPM), an important metric in digital advertising.
52. Location-based marketing strategies can be 20 times more effective than regular banner ads.
Intrusive banner ads, even smartly deployed ones, are on their way out. Smart strategies that make good use of the mobility of the consumer to present relevant ads are the new normal. Companies have many mobile marketing stats and tools at their disposal to hone their ads for optimal results.
53. Over $1T of ecommerce sales in China will be done via mobile devices by the end of 2018.
This represents more than 75% of the total ecommerce sales in the country. This proliferation of mobile buying in China is not an anomaly and is a trend being seen in most economies now.
54. 71% of marketers believe mobile marketing is core to their business.
Marketers are waking up to the potential of mobile and planning their marketing accordingly. They are beginning to realize marketing needs to be more customer-centric, customer-controlled and up-to-date with technological advancements.
55. 68% of companies have integrated mobile marketing into their overall marketing strategy in 2018.
This realization has already inspired a significant majority of companies to take adequate steps to modify their marketing strategy. Businesses slow to adapt to this reality will find it much tougher to grow, or even maintain, their consumer base.
56. Marketers and advertisers put 51% of their budget into mobile ads.
According to PwC research on mobile marketing statistics, even two years ago, advertisers were allocating a larger chunk of their annual budgets to mobile ads. This is shaping up to be a persistent upward trend.
57. 66% of marketers say they use mobile-optimized templates.
An important component of adopting a mobile-friendly marketing strategy is to ensure your content stays as appealing on a mobile screen as it does on other platforms.
58. Location-targeted mobile ad spend will grow from $12.4B in 2016 to $32.4B in 2021.
No wonder then that location-targeted ad spending is getting a big chunk of the total ad spend pie. An estimated growth rate of over 160% in 5 years is as clear a sign as any of how mobile spending is changing.
59. Mobile is responsible for an average of more than 40% of revenue in leading B2B organizations.
As we have seen earlier, trends in mobile usage are not limited to B2C commerce. B2B marketing leaders are using mobile to engage customers as often as in any other situation, and are being rewarded with faster decision making and higher customer royalty.
60. Mobile marketing can speed up B2B time by 20%.
Faster purchase action is one of the biggest benefits in traditionally slow-moving B2B commerce. BCG research shows the new generation of B2B customers does not expect to deal with a salesperson until it’s time to close the deal. This is the segment most receptive to mobile marketing.
Mobile Marketing Stats 2019 Key Takeaways
- The use of mobile devices to access the internet is a prevalent (and still growing) trend around the world. That’s thanks in no small measure to the availability of cheaper and more powerful smartphones.
- This spurt in mobile internet access often comes at the cost of desktop devices.
- Users are now more comfortable making online purchases on phones than ever before.
- A substantial movement of digital ad spending is now moving toward mobile advertising.
- The money flowing into the business fuels more technological innovation, which, in turn, helps even more in the development of smart revenue generating opportunities.
- However, marketers can partake of this huge pie only if they pay heed to mobile marketing statistics and deliver a consistently enjoyable and meaningful experience to their customers.
Looking to build customer loyalty through social media? Don’t forget to add your business to Top4 Marketing
List your business, create your own digital store to sell goods and services, and share posts on social media. Promote your business on Google instantly! Should you need help with local digital marketing then view our new Google Marketing Platform and services Top4 Marketing
Get Found On Google Promote Your Website, Reach local customers today!
Our Digital Marketing Agency Services Across All Industries Include Search Engine Optimisation (SEO), Google Marketing, Website Design, Corporate Web Development, and local location-based marketing using our own Google Marketing Platform!
Engage A Social Media Agency For Only 1/3 The Cost Of Employing A Social Media Manager…LET’S TALK!
Source: 99firms