Creating reports is inherent to every social media management activity. At first glance, it may seem like a simple routine task – you pull your best numbers in one spreadsheet, export data from social media tools, and put it all into your template (or borrow a template from someone else). Send the report to your boss or your colleagues – that’s it.
If it really were that basic, you wouldn’t be reading this article. The truth is, reporting is one of the most valuable and crucial parts of social media marketing – and it deserves your due attention.
Without reporting, you’re going into social media marketing blind. Social media reports show you what works and what doesn’t. Sure, you can see that, say, some of your posts perform better than others, but only a comprehensive report will help you analyze the strengths and weaknesses of your social media strategy.
The @epicurious channel is a case study in a brand figuring out Youtube. A year ago they were posting mostly recipes. Avg views: ~5k. The outlier was a “Kids Try 100 years of X” series. Now their entire channel is “try” and “guess” vids and nearly every one breaks mils of views. pic.twitter.com/CRaYtyOApb
— Greg Leppert (@leppert) February 18, 2019
The ongoing reports which provide an overview of your progress on social over a certain period of time are essential to revise your strategy.
You can also create one-off reports to analyze specific activities like campaigns or contests. Additionally, there are research reports which can (and should) inform your marketing decisions based on social data.
Regardless of the type of report, you’re creating, the core process is similar. Here are the five steps to follow to generate any type of social media report from scratch.
Step 1: Define your goals
Before you do something, you need to understand why you’re doing it. A comprehensive social media report dedicated to your ongoing activity will reflect whether you’ve hit your goals, how your strategies are working, and what your successes are. It’ll also explain any failures, and show you the ways to address them efficiently.
For instance, thanks to your report, you and your team could discover a decrease in your engagement numbers in November and attribute them to either a change in your content strategy or the holiday season.
As for specific reports, to make them as helpful and actionable as possible, pose a specific question. For example, a report focused on a marketing campaign might ask, “did the campaign drive spontaneous conversation among the target group of 15-34-year-old male sports fans?”. A research report could ask “What do Millennials who live in big cities want from an Internet service provider?”
Step 2: Define your recipient
Who will receive the report? How can it benefit them? Think about the decisions your reports are supposed to inform and support.
- Does the head of sales need to understand how many leads come from social?
- Does the community management team want to know the efficiency of their strategy?
- Do you want to convince the head of marketing to invest in video content production?
These are just some questions that may come up in your social media marketing endeavors. As you might have noticed, defining goals and recipients go hand-in-hand – who needs insights, and why they need them, are the main questions to build your report around.
Step 3: Define the time frame
The period of time covered by your report may depend on the purpose of the report (i.e. a campaign report will cover the timeline of a campaign) or your preferred workflow.
The following time intervals are the most common:
- Weekly report
- Monthly report
- Quarterly report (90 days)
At this step, you should also consider how you want to evaluate your progress. Do you want to compare your performance to the previous month (if you’re doing monthly reports)? Or maybe you’d like to see how your key figures compare to those from the same month of the last year?
Step 4: Decide what metrics to include
Now that you know why you’re making a report, you can think of what data you need to present. This is truly the cornerstone of reporting, and social media platforms have a multitude of native metrics which can be rather overwhelming, let alone all sorts of data from third-party social media tools.
Knowing the purpose can help you hone your focus onto a specific set of metrics which showcases your successes and slip-ups in a chosen area.
Here are some of the data points you might want to focus on and the ways to find them.
Volume of content
Volume of content is one of the easiest ways to demonstrate to your boss that you’re not just looking at memes on Twitter.
In all seriousness, the volume of content is quite a popular metric in social media reports, which, paired with others, lets you analyze your content sharing efforts.
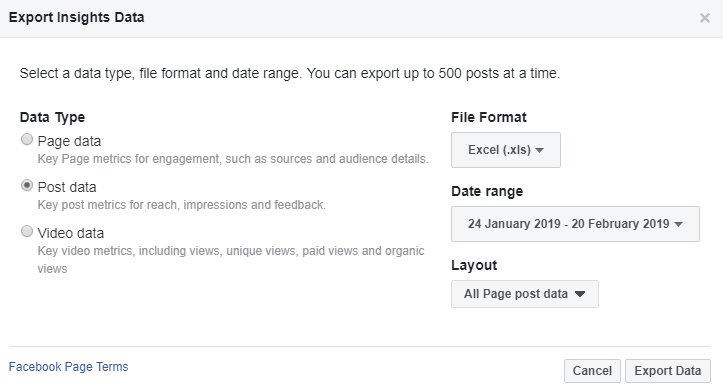
This one is quite unimaginative: you just go to Insights and export the Post or Tweets data for Facebook and Twitter respectively (narrowing it down to a required period of time). There you will see the rows of your social media updates with columns for individual stats on each update. Simply count the number of rows and you’ll get the results.
For Instagram, you can see the number of posts sorted by different filters in your Insights under the Content tab. You can’t choose a custom period of time, but Instagram enables you to view stats for 7 or 30 days, 3 or 6 months, and 1 or 2 years.
Reach or exposure
The reach metric helps you understand the size of your audience. This is a tricky one, since some marketers measure their audience by the number of followers or subscribers they have. However, what you really want to know is how many people see your content, and that’s where reach comes in handy.
Where to find it:

On Facebook, you should go to your Page Insights and export Post data. In the Lifetime Post Total Reach column, you will be able to see the reach for each Facebook post. You can check your total reach by going to Insights>Reach.
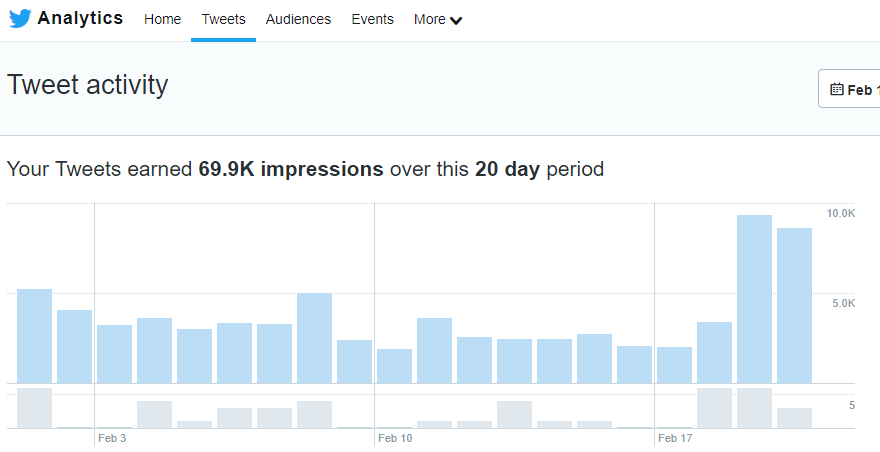
Twitter shows you the Impressions for each tweet and the number of Impressions for a chosen period in Analytics>Tweets.
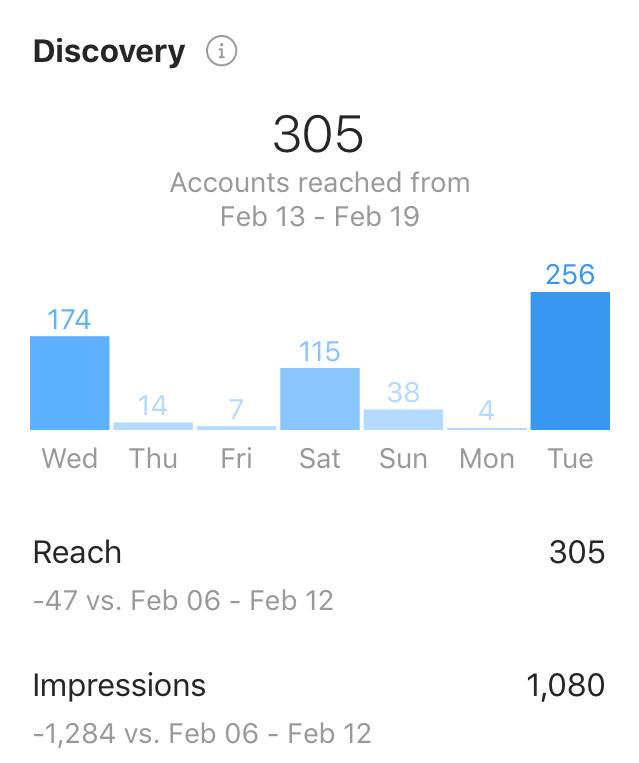
On Instagram, you can find your weekly reach in the Insights. Unfortunately, you can’t specify a time period for your results, so if you need Instagram data, you’ll have to record it manually every week.
Engagement
Engagement enables you to analyze the quantity and quality of the interactions your accounts and posts get.
Engagement is one of the most important metrics for growth – most major social media platforms have made engagement the main focus of their algorithms. In other words, the more engagement you get, the more exposure your brand receives.
Where to find it:
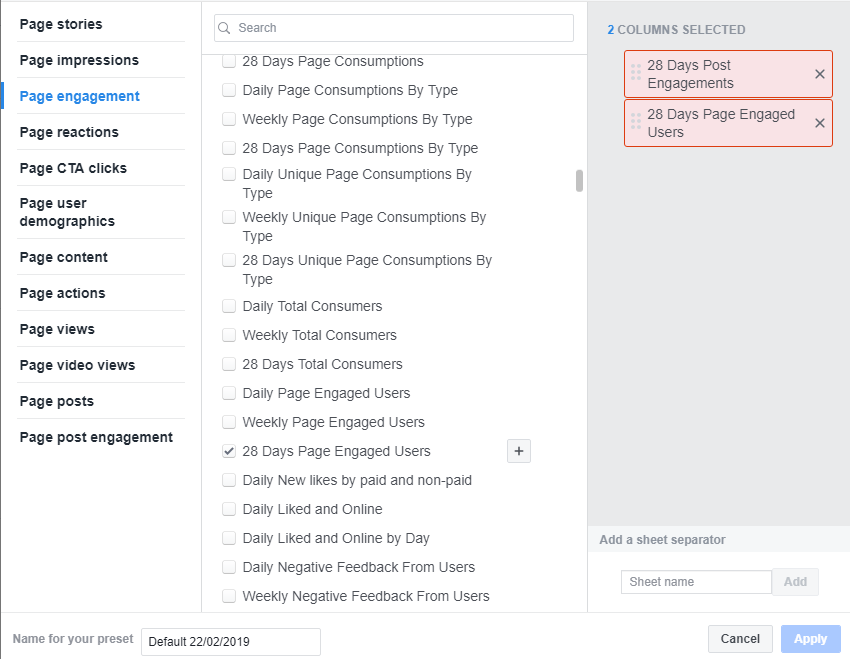
For Facebook, you’ll need to go to Page Insights once again and download your Page Data (click Layout>Make new layout to only select data related to engagement). There you can see the number of Engaged Users and Post Engagements.
You can also track post-by-post engagement by exporting post data with Layout>Post engagement selected.
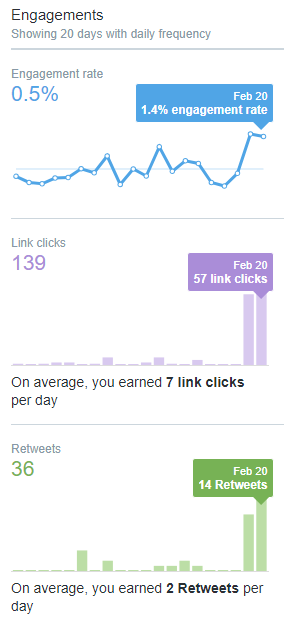
For Twitter, you’ll find engagement metrics on the same page as the reach metrics. You can export data to see engagement per Tweet.
For Instagram, you can see the number of Interactions in your Activity tab, or check out Engagement numbers for each post in the Content tab in Insights.
Audience

Social media platforms give you a lot of information about your audience – you can learn who participates in a conversation, where your users come from, when they are active, what languages they speak, etc.
Where to find it:
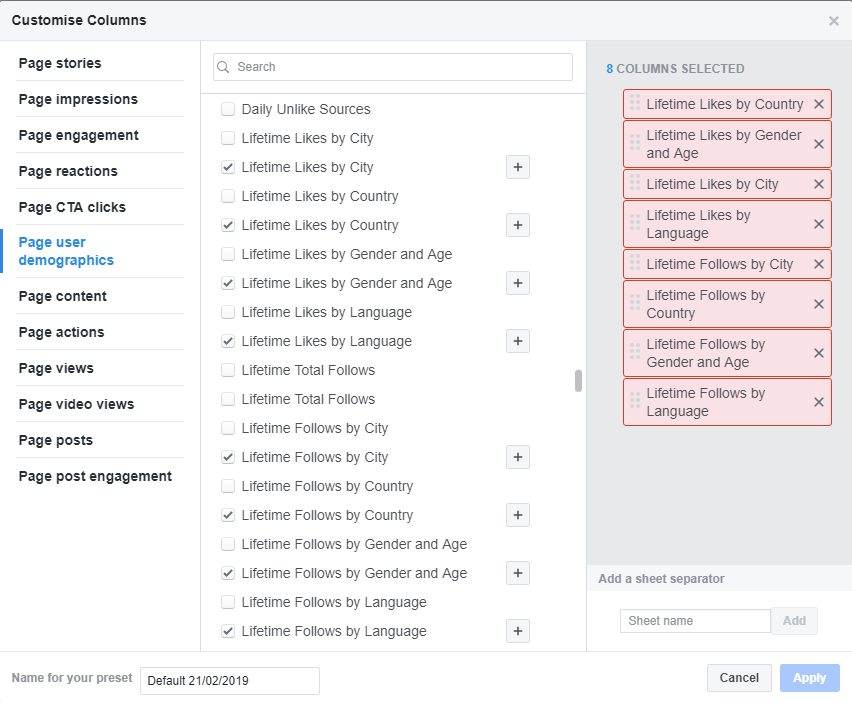
For Facebook, go to your Insights> Export. Choose Page user demographics data under Layout.
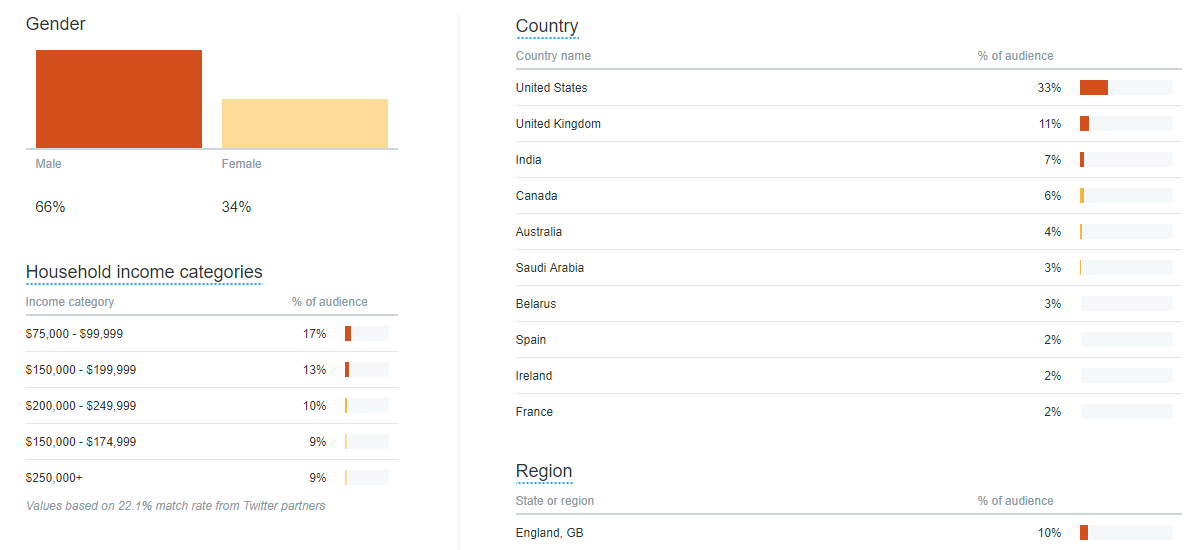
On Twitter, there’s a separate tab in your Analytics called Audiences. Here, you can see data for all Twitter users, your followers, your organic audience, and your tailored audience which you can create in Twitter Ads by uploading email addresses, Twitter usernames, or mobile advertising IDs.
The data is quite comprehensive – you can learn about your audiences demographics, lifestyle, and behavior. However, note that Twitter Audiences data is not exportable.
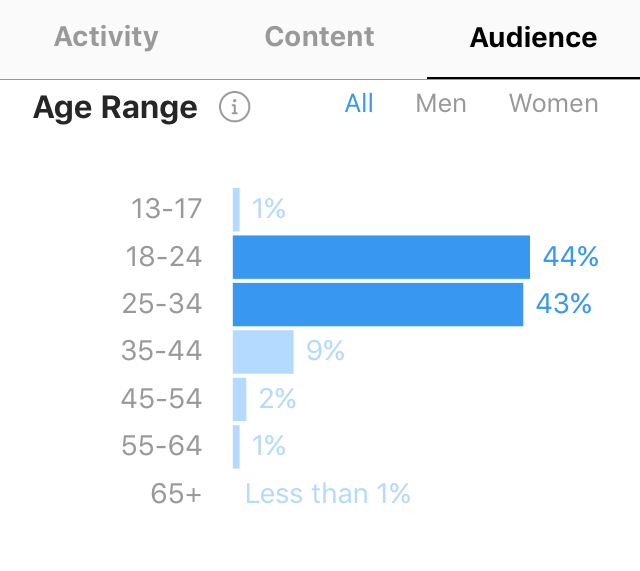
As for Instagram, in your Insights, you have an Audience tab which tells you the age, location, and gender of your audience.
Clicks and traffic
Ultimately, you want to drive customers to your website (unless you work at a brick-and-mortar business, perhaps). One of the most convincing proofs of your success here is clicks on your shared links, and social media traffic. For social advertising, the number of clicks is especially important.
Where to find it:
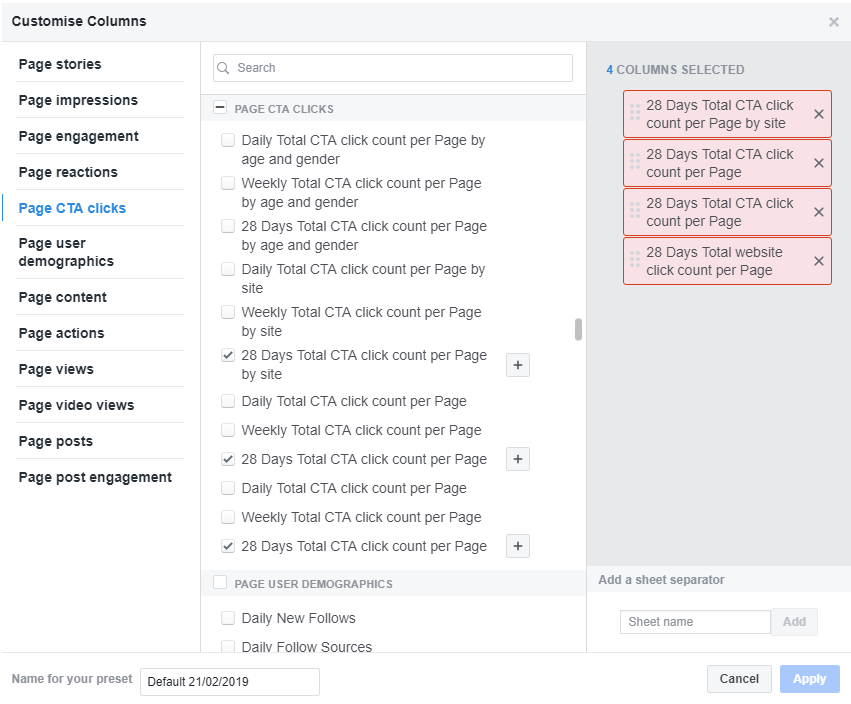
For Facebook, in your exported data you can look up the number of clicks on your CTAs (promotions), website links, phone number in your profile and so on.
Twitter will show you the number of clicks for a chosen time period in the Tweets tab. You can also see the number of clicks per post in the exported data.
On Instagram, you can check the Website clicks (the link you put in your bio) and clicks from your advertisements.
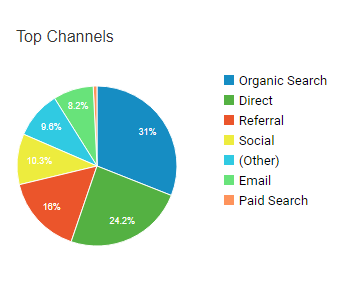
You can also access your traffic data in Google Analytics. Go to All Traffic>Channels to see what percentage of your traffic comes from social media.
If you’re interested in a particular social media platform, go to Acquisition>Social>Network Referrals and see the dissection of social referrals by platform.
Social listening data
Social listening data may be included in your regular ongoing report – for example, data that comes from brand monitoring fits nicely with engagement and reach insights.
You can also prepare reports for special occasions, like market research and campaign monitoring reports.
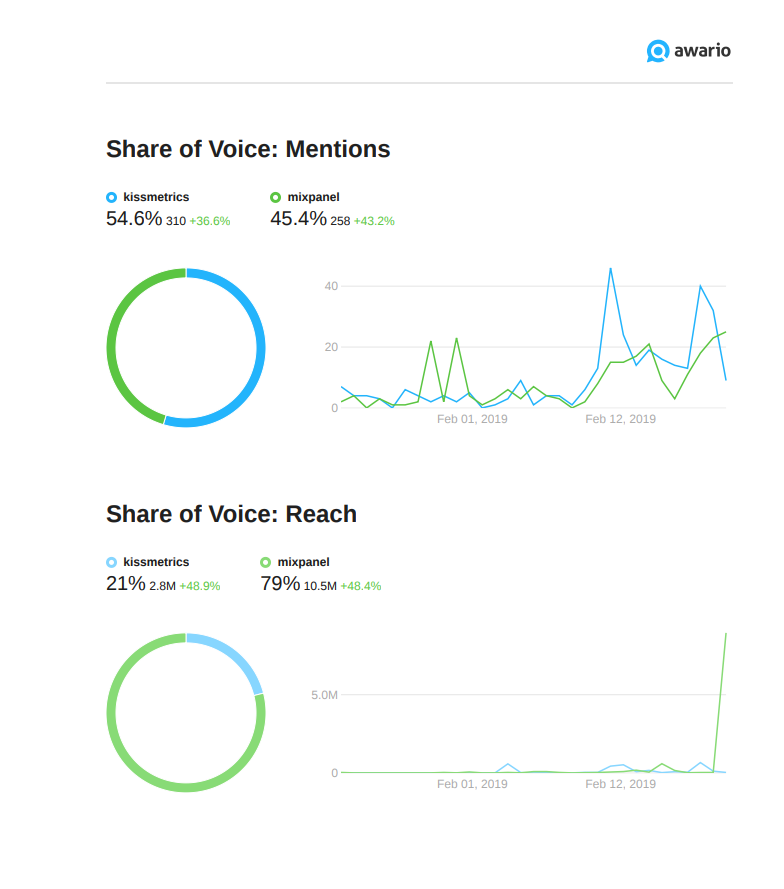
Some social listening tools will give you even more options – for example, Awario enables you to create competitor comparison and influencer research reports in PDF.
Where to find it:
Every social listening tool, and some social media management tools (Sprout Social, Agorapulse, and Hootsuite to name a few), have social listening reporting features.
They may include social listening data in the overview report or an option to create a separate report. Note that most social media management tools lack social listening capabilities necessary for market research and competitor analysis, hence you’ll need to use a dedicated social media monitoring tool for insights on your market and competition.
Step 5: Design the report
This might be the most challenging step – organizing the collected data in the most logical and comprehensible way is not easy.
Here are some general tips that could be relevant for any report:
- Don’t overwhelm the reader – Don’t try to fit as much information as possible into one sheet. Unless it’s an extremely simple report, designate at least one page per each section.
- Visualize what’s important – Let’s say, you’re comparing your reach with the previous month and notice that it has significantly grown. Emphasize it by highlighting with a bright color.
- Add actionable insights – For example, including segments like “Top 5 posts” in Reach, Engagement and Clicks sections enables you to point out the most effective activities.
The quickest way to do it is to use Google Sheets or Google Docs. Here are some ready-made templates created by Buffer.
If you need something more sophisticated, you can also create your own template for regular use in Photoshop or a more accessible tool (Venngage, Infogram, etc.)
Obviously, when you’re using a social media management tool, you can utilize it to generate reports, however, there is a downside – these reports might lack or under-represent some crucial metrics, or include the metrics which are of no interest to your recipient. In other words, to customize a report according to your goals, you will need to design it yourself most of the time.
That’s it. Making a social media report may seem like a giant, complex task, but by breaking it down into simple steps, you’ll be able to generate any social media report you can think of.
Looking to build customer loyalty through social media? Don’t forget to add your business to https://www.top4.com.au/
List your business, create your own digital store to sell goods and services, and share posts on social media. Promote your business on Google instantly! Should you need help with local digital marketing then view our new Google Marketing Platform and services http://www.top4marketing.com.au/pricing/
Get Found On Google Promote Your Website, Reach local customers today!
Source: Social Media Today